

Availability Rate and Mission Readiness
¶ 4. Availability Rate and Mission Readiness
Note on cost basis: All USD amounts from US government sources (GAO, CBO, DoD) in this article are expressed in Base Year 2012 Dollars (BY2012$). Adjusted for inflation to 2026, actual values are approximately 40–50% higher.
¶ Mission Capable Rate: A Declining Trend
The Mission Capable (MC) rate of the F-35A has shown a continuous decline since 2020 [22]:
| Fiscal year | MC rate F-35A | Difference from 80% goal |
|---|---|---|
| 2020 | 71.4% (peak) | -8.6 percentage points |
| 2021 | 68.8% | -11.2 |
| 2022 | 56.0% | -24.0 |
| 2023 | 51.9% | -28.1 |
| 2024 | 51.5% | -28.5 |
| 2025 | 38.6% | -41.4 |
Sources: GAO-26-108113, fig. 6 [22]; for FY2024 also Air & Space Forces Magazine [14]. US fiscal year: 1 October to 30 September.
¶ Full Mission Capable Rate: Fully Mission Capable Only About a Quarter of the Time
The Full Mission Capable (FMC) rate measures the share of time during which an aircraft can perform all of its tasked missions. According to GAO, it fell across the entire US fleet from 38.1% (FY2021) to 24.6% (FY2025); the US Air Force's F-35A reached 28.5% in FY2025 [22]. FY2025 is the most recent fiscal year for which published figures are available.
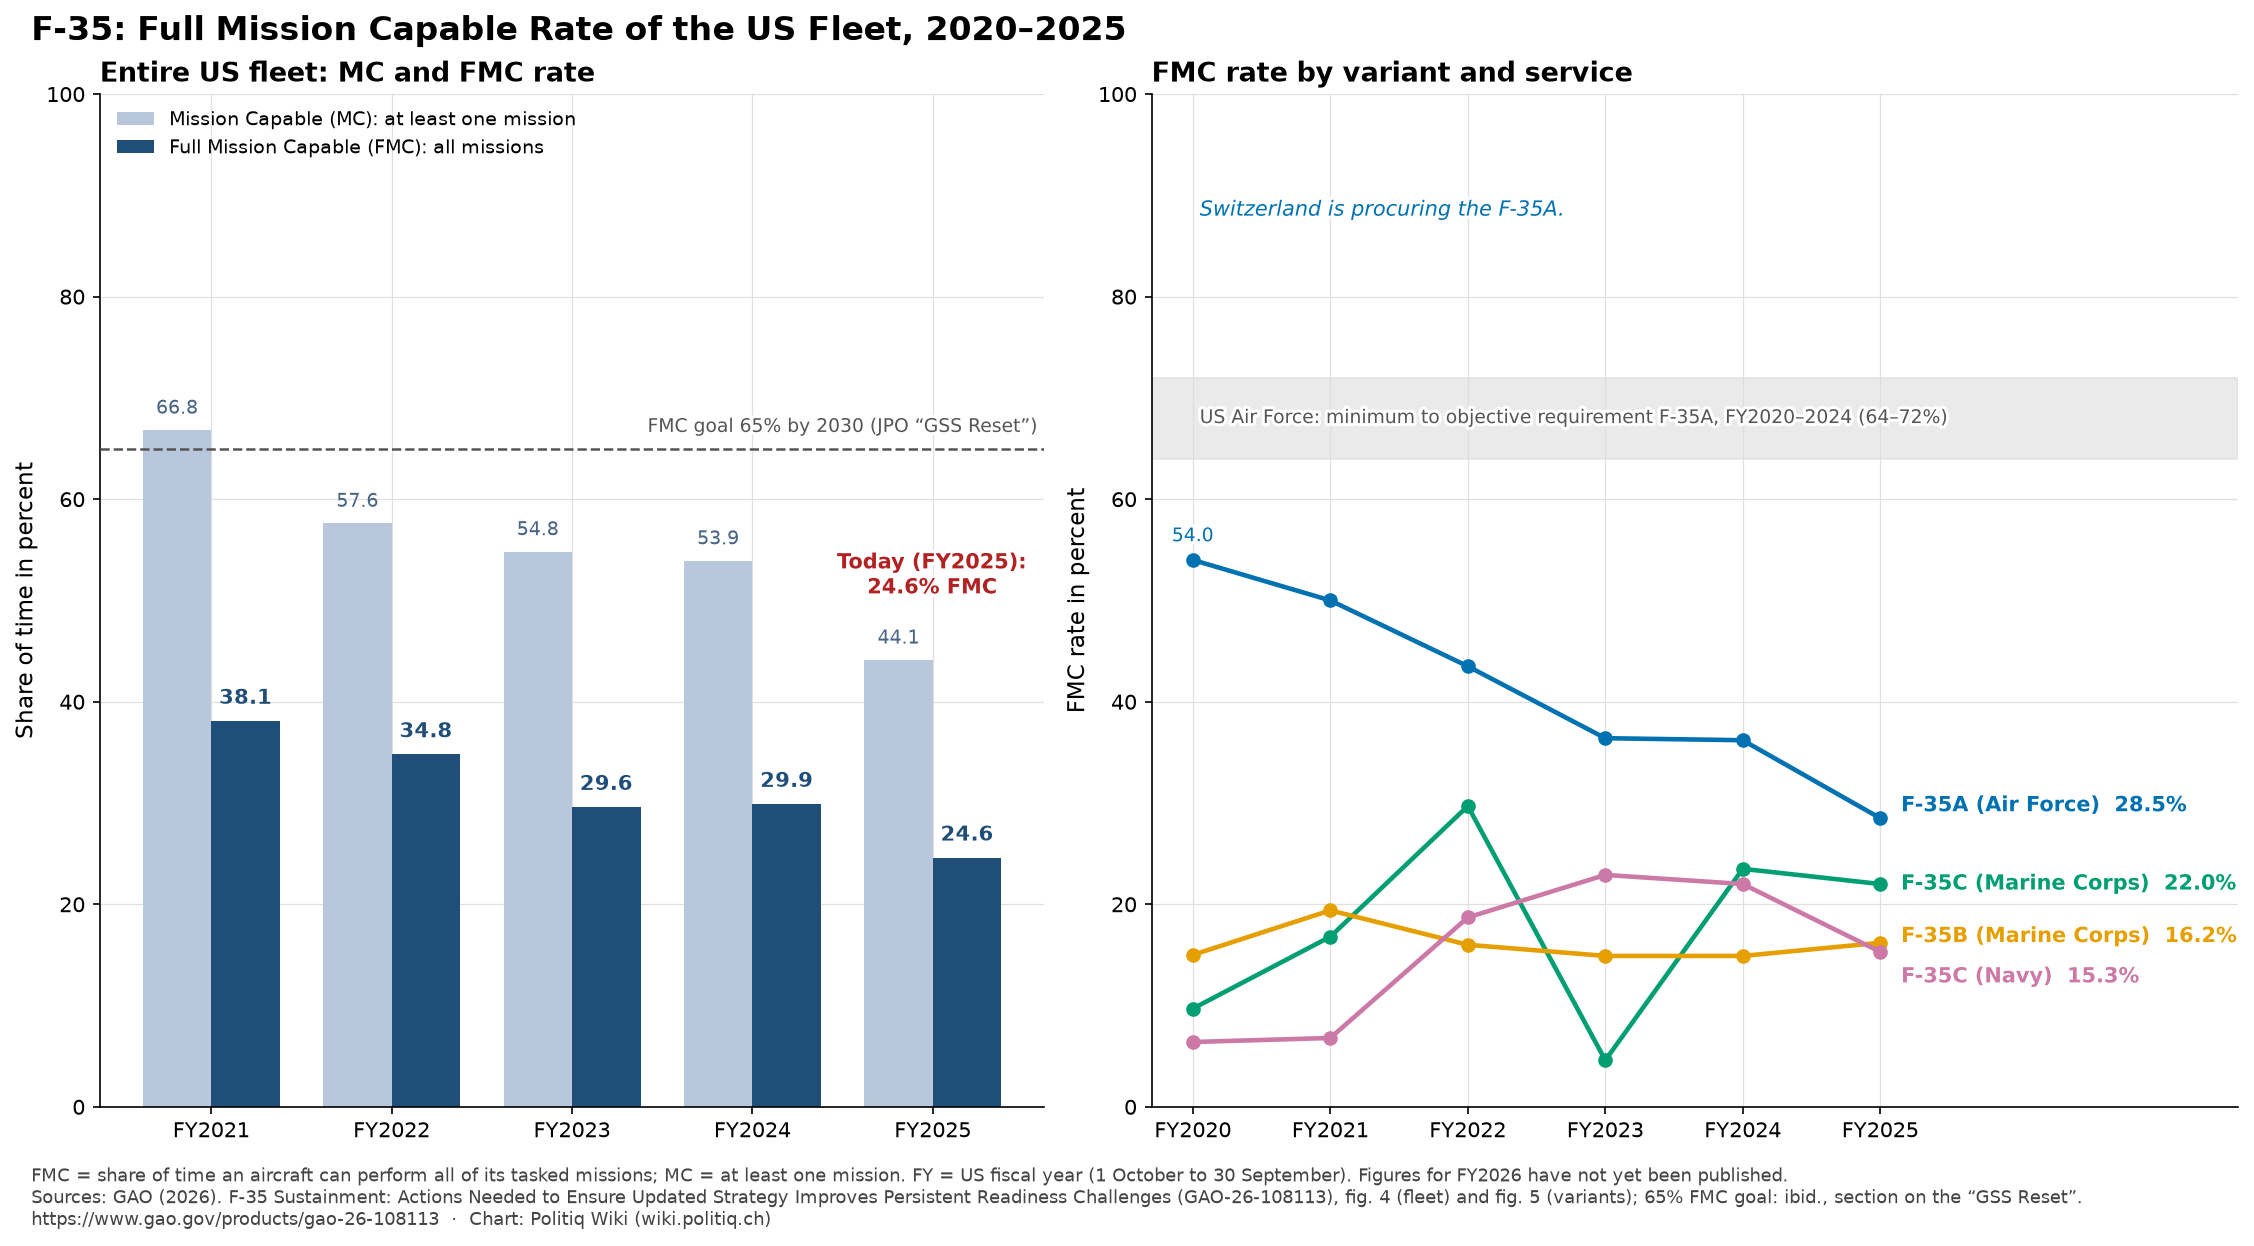
Chart: Politiq Wiki, own presentation of the figures from GAO-26-108113, figs. 4 and 5 [22].
How to read the chart:
- Left half – entire US fleet (FY2021–FY2025): For each fiscal year, two bars stand side by side. The light blue bar shows the MC rate (the aircraft can fly at least one of its missions), the dark blue bar the FMC rate (the aircraft can fly all of its missions). The difference between the two bars is the share of time in which an aircraft can fly but is only partially usable. The FMC rate fell from 38.1% via 34.8%, 29.6% and 29.9% to 24.6%, the MC rate from 66.8% to 44.1%. The dashed line at 65% marks the FMC goal the Joint Program Office has set for 2030.
- Right half – FMC rate by variant (FY2020–FY2025): Each line represents one variant and the service operating it: F-35A of the US Air Force (blue), F-35B of the Marine Corps (orange), F-35C of the Marine Corps (green) and F-35C of the Navy (purple). The value for FY2025 is shown at the right edge. The F-35A fell from 54.0% to 28.5%, the F-35B stayed between 14.9% and 19.4% throughout, and the two F-35C fleets fluctuated strongly (Marine Corps between 4.6% and 29.7%, Navy between 6.4% and 22.9%).
- Grey band: It shows the US Air Force requirement for the F-35A for FY2020–FY2024, from the minimum (64%) to the objective (72%). For FY2025 the Air Force set 65% and 80% respectively. The F-35A was not within or above the band in any year.
- Why the F-35A is highlighted: Switzerland is procuring the F-35A. Its figures are therefore the most relevant for Switzerland, but they come from US Air Force operations and cannot be transferred directly to a Swiss fleet.
The rates indicate the share of time during which the units' aircraft were in the respective condition. According to GAO, the FMC rate only takes into account aircraft in the possession of F-35 units. The US fiscal year runs from 1 October to 30 September. No figures have yet been published for FY2026.
With its revised sustainment strategy ("GSS Reset"), the F-35 Joint Program Office aims for a fleet-wide MC rate of 80% and an FMC rate of 65% by 2030. It estimates that this will require roughly an additional USD 13.7 billion through fiscal year 2031 [22].
¶ "War on Readiness": Goal Missed
In 2023, the F-35 Joint Program Office launched a "War on Readiness" with the aim of raising the MC rate by 10 percent by the end of March 2024. According to program officials, it rose by only 2.6 percent to 55.7% within that year [23].
¶ Spare Parts Shortage and Cannibalization
In December 2025, the Pentagon's Inspector General documented that F-35 squadrons remove parts from other aircraft because of parts shortages (cannibalization): squadron VFA-125 at Naval Air Station Lemoore cannibalized a total of 89 parts from different F-35Cs between November 2024 and February 2025 [24].
As early as May 2023, GAO found that one of the prime contractors had incurred losses of over 1 million spare parts worth over USD 85 million since May 2018; the Joint Program Office had reviewed less than 2% of them [25].
¶ CBO Comparison: F-35 Like a 36-Year-Old F-16
The CBO report of June 2025 found that the average availability rate of a 7-year-old F-35A is about the same as that of a 36-year-old F-16C/D [26].
¶ Swiss Scenario
| Scenario | Available jets (30 units) | Fully mission capable (FMC 30%) |
|---|---|---|
| US goal (80% MC) | 24 | 9 |
| Program goal (65%) | 19–20 | 6 |
| Reality 2024 (51.5%) | 15–16 | 4–5 |
At current performance, Switzerland would on average have 15 aircraft available for at least one mission and only 4–5 aircraft for all missions. For 24/7 airspace surveillance with reserves for training and maintenance, this is a tight calculation.
¶ References
[14] Air & Space Forces Magazine (2024). Air Force Mission Capable Rates Reach Lowest Levels in Years
[22] U.S. Government Accountability Office (2026, June). F-35 Sustainment: Actions Needed to Ensure Updated Strategy Improves Persistent Readiness Challenges (GAO-26-108113)
[23] Defense One (2024, 21 October). F-35s still missing readiness goals, despite rising spending
[24] U.S. Department of Defense, Office of Inspector General (2025, 19 December). Audit of the DoD’s Oversight of Contractor Performance for the F-35 Joint Strike Fighter Sustainment Contracts (DODIG-2026-039, PDF)
[25] U.S. Government Accountability Office (2023, May). F-35 Program: DOD Needs Better Accountability for Global Spare Parts and Reporting of Losses Worth Millions (GAO-23-106098)
[26] Congressional Budget Office (2025, June). Availability, Use, and Operating and Support Costs of F-35 Fighter Aircraft