¶ Chart Directory
All charts of this wiki at a glance. Each chart is embedded in context within its respective chapter -- here you will find the complete overview with descriptions and source references.
¶ Title Image
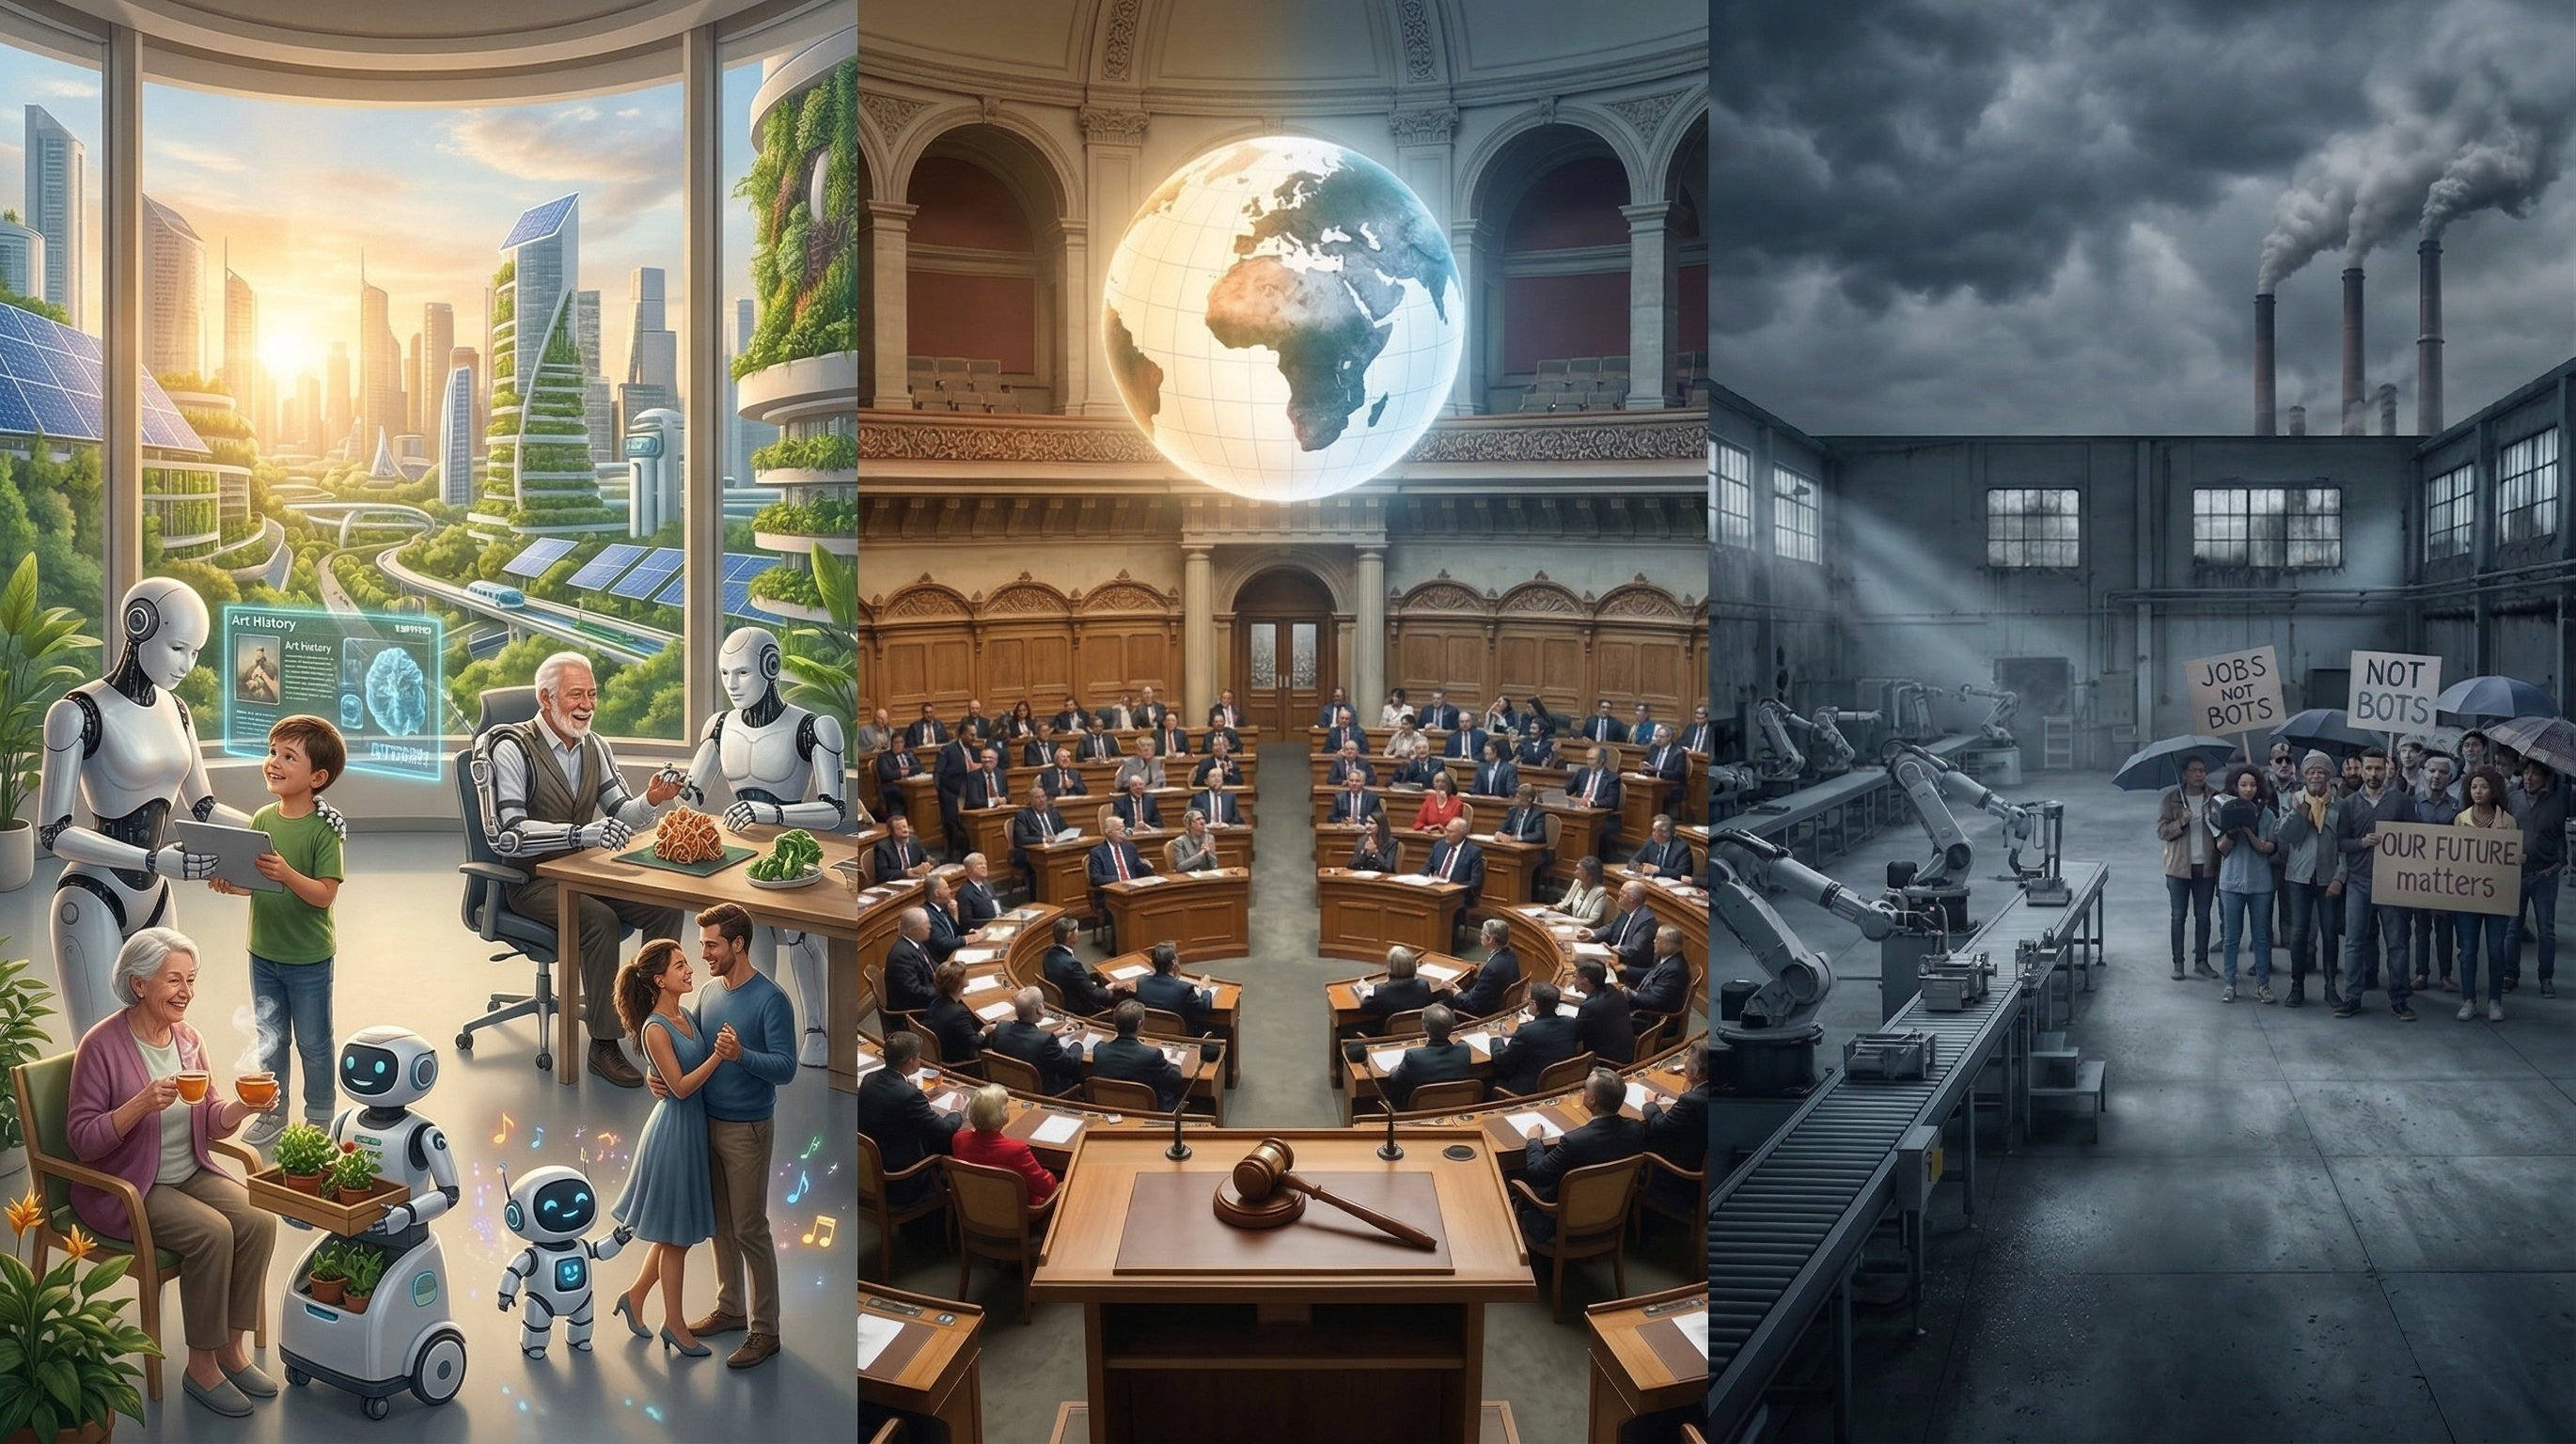
Description: The title image shows three scenarios of the AI future: on the left the technological promise (robots as everyday helpers, green cities, education), in the centre the political arena (parliamentary debate under a globe), on the right industrial disruption (robots replacing workers, protest with "Jobs Not Bots" signs). The three areas symbolise the spectrum between opportunity and risk.
Usage: Home page
¶ Chapter 1: Status Quo
¶ Scaling Curve of Large Language Models
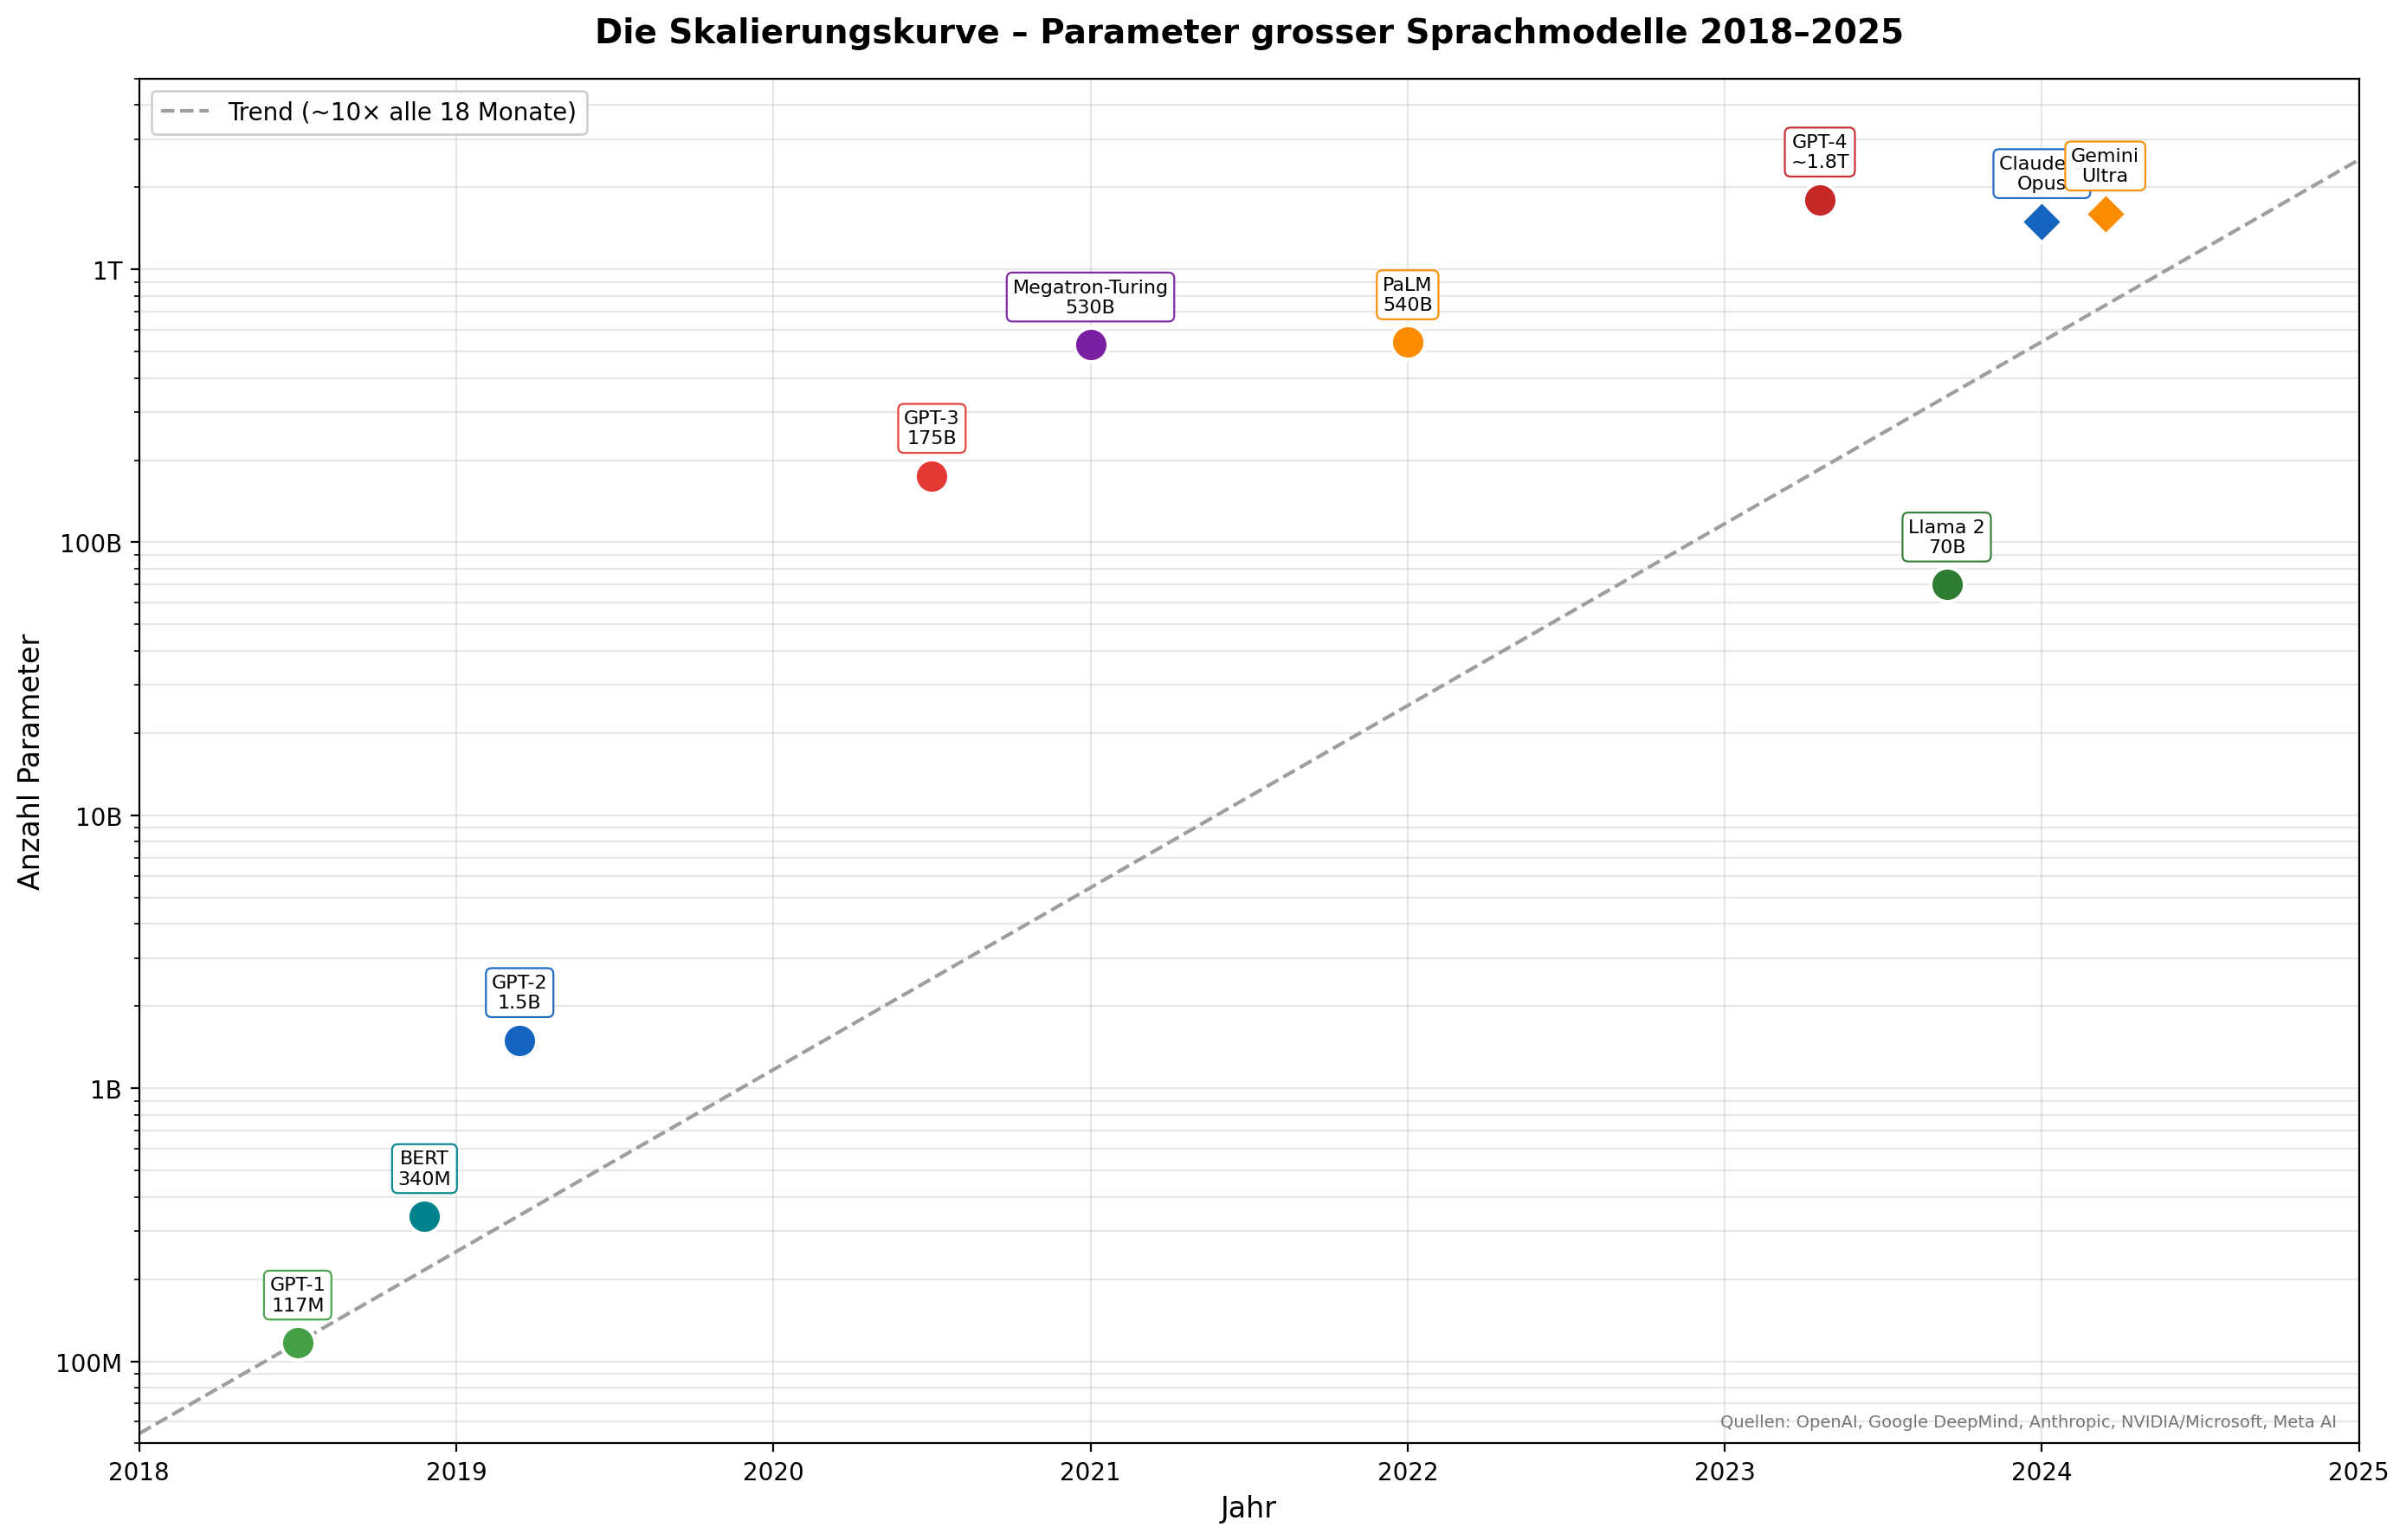
Description: Shows the exponential growth of model size from GPT-2 (2019, 1.5 billion parameters) through GPT-3 (2020, 175 billion) to GPT-4 (2023, estimated 1.8 trillion). Illustrates the scaling laws driving current AI progress. The larger the model and the more training data, the better the performance -- a pattern that has held since 2018.
Sources: OpenAI, Google DeepMind, Anthropic (model size data)
Usage: Status Quo -- Overview
¶ Evolution of Neural Network Architectures
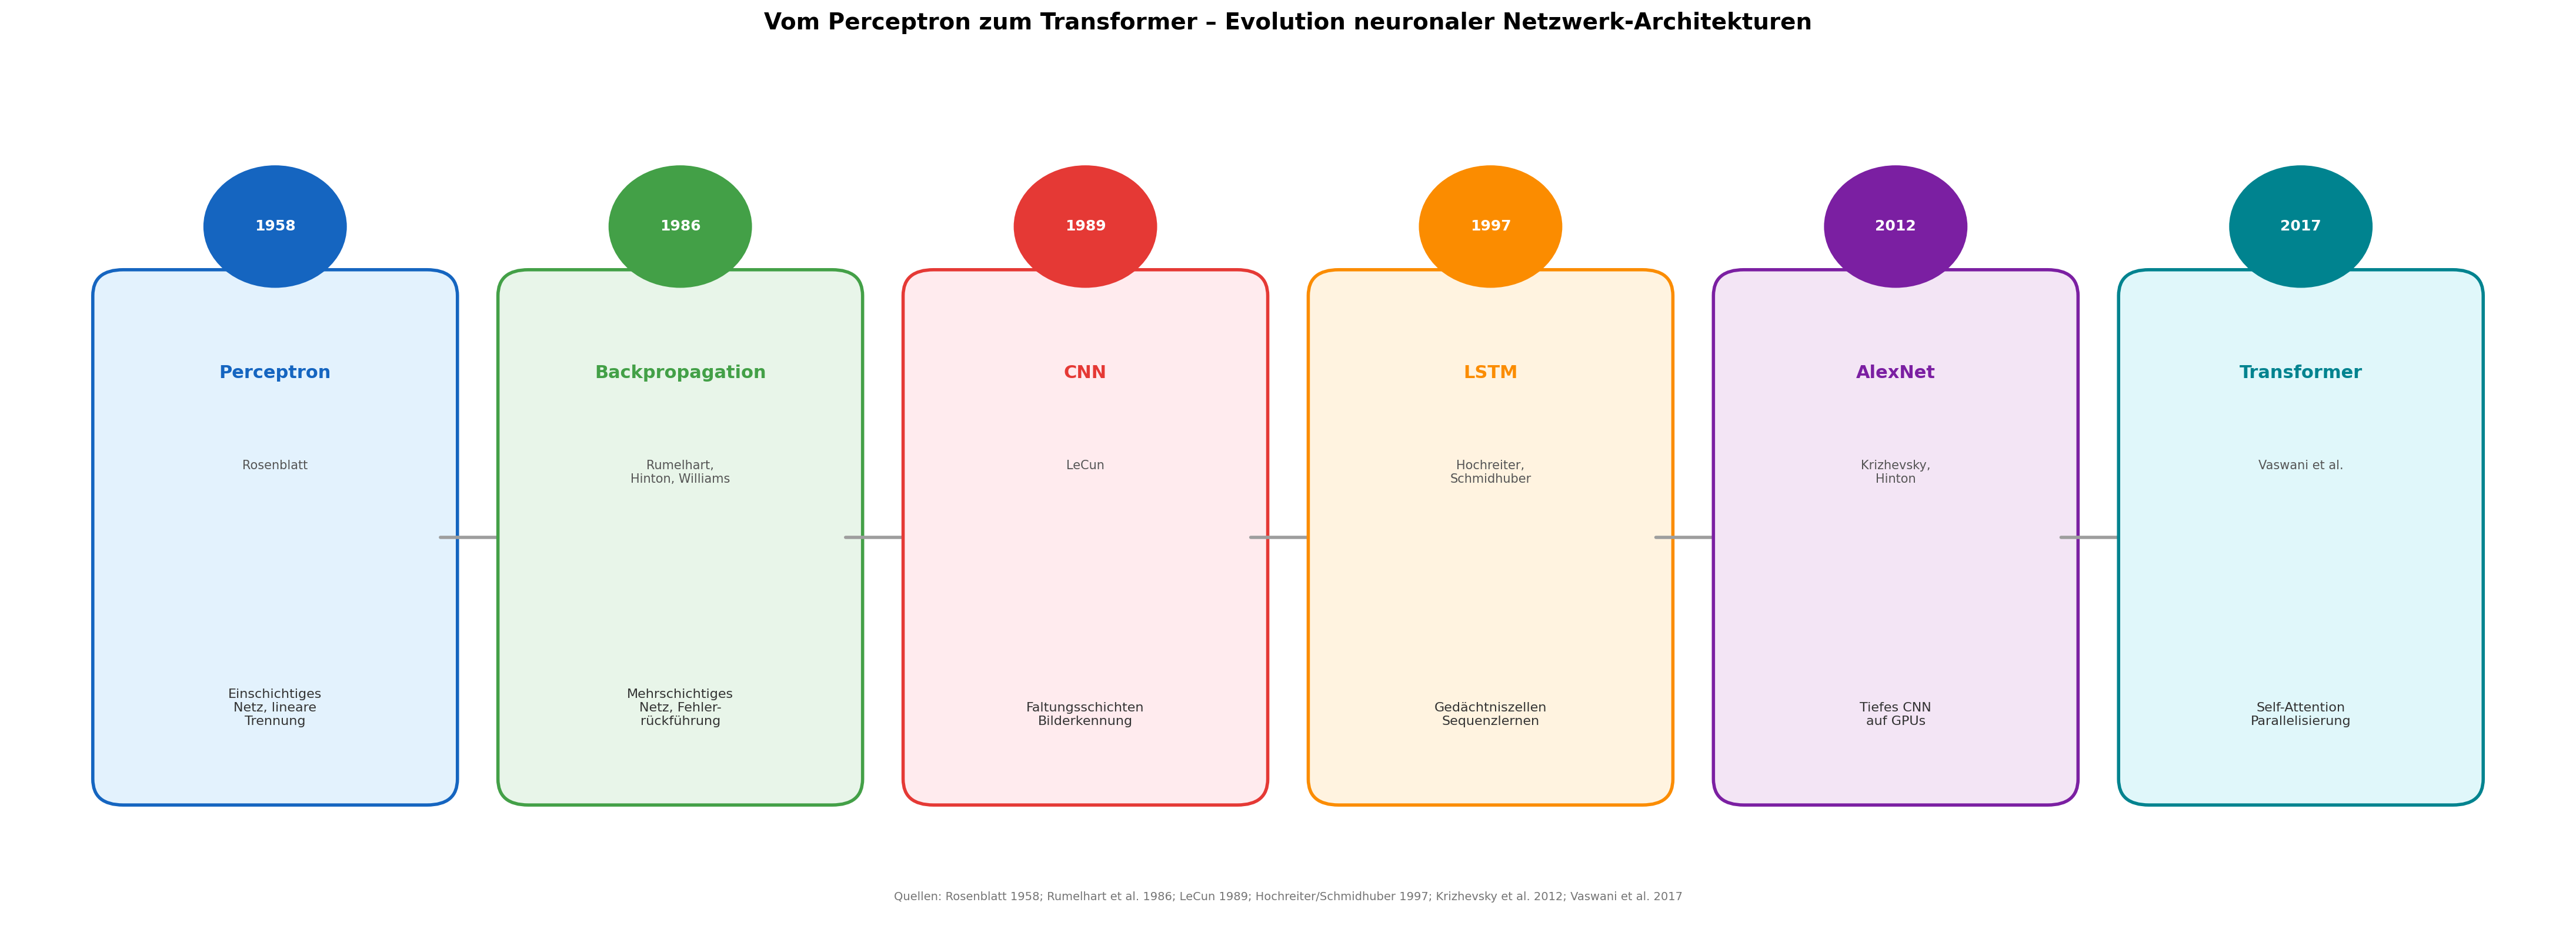
Description: Chronological representation of the most important network architectures: Perceptron (1957), Multi-Layer Perceptron (1986), CNN (1998), LSTM (1997, IDSIA Lugano), Deep Learning / AlexNet (2012), Transformer Architecture (2017, Google "Attention is All You Need"). Shows the path from simple single-layer networks to today's transformer-based AI.
Sources: Rosenblatt 1957; Rumelhart/Hinton 1986; Hochreiter/Schmidhuber 1997 (IDSIA); Vaswani et al. 2017
Usage: What AI Can Do Today
¶ Which Professions Are Affected When (Timeline)
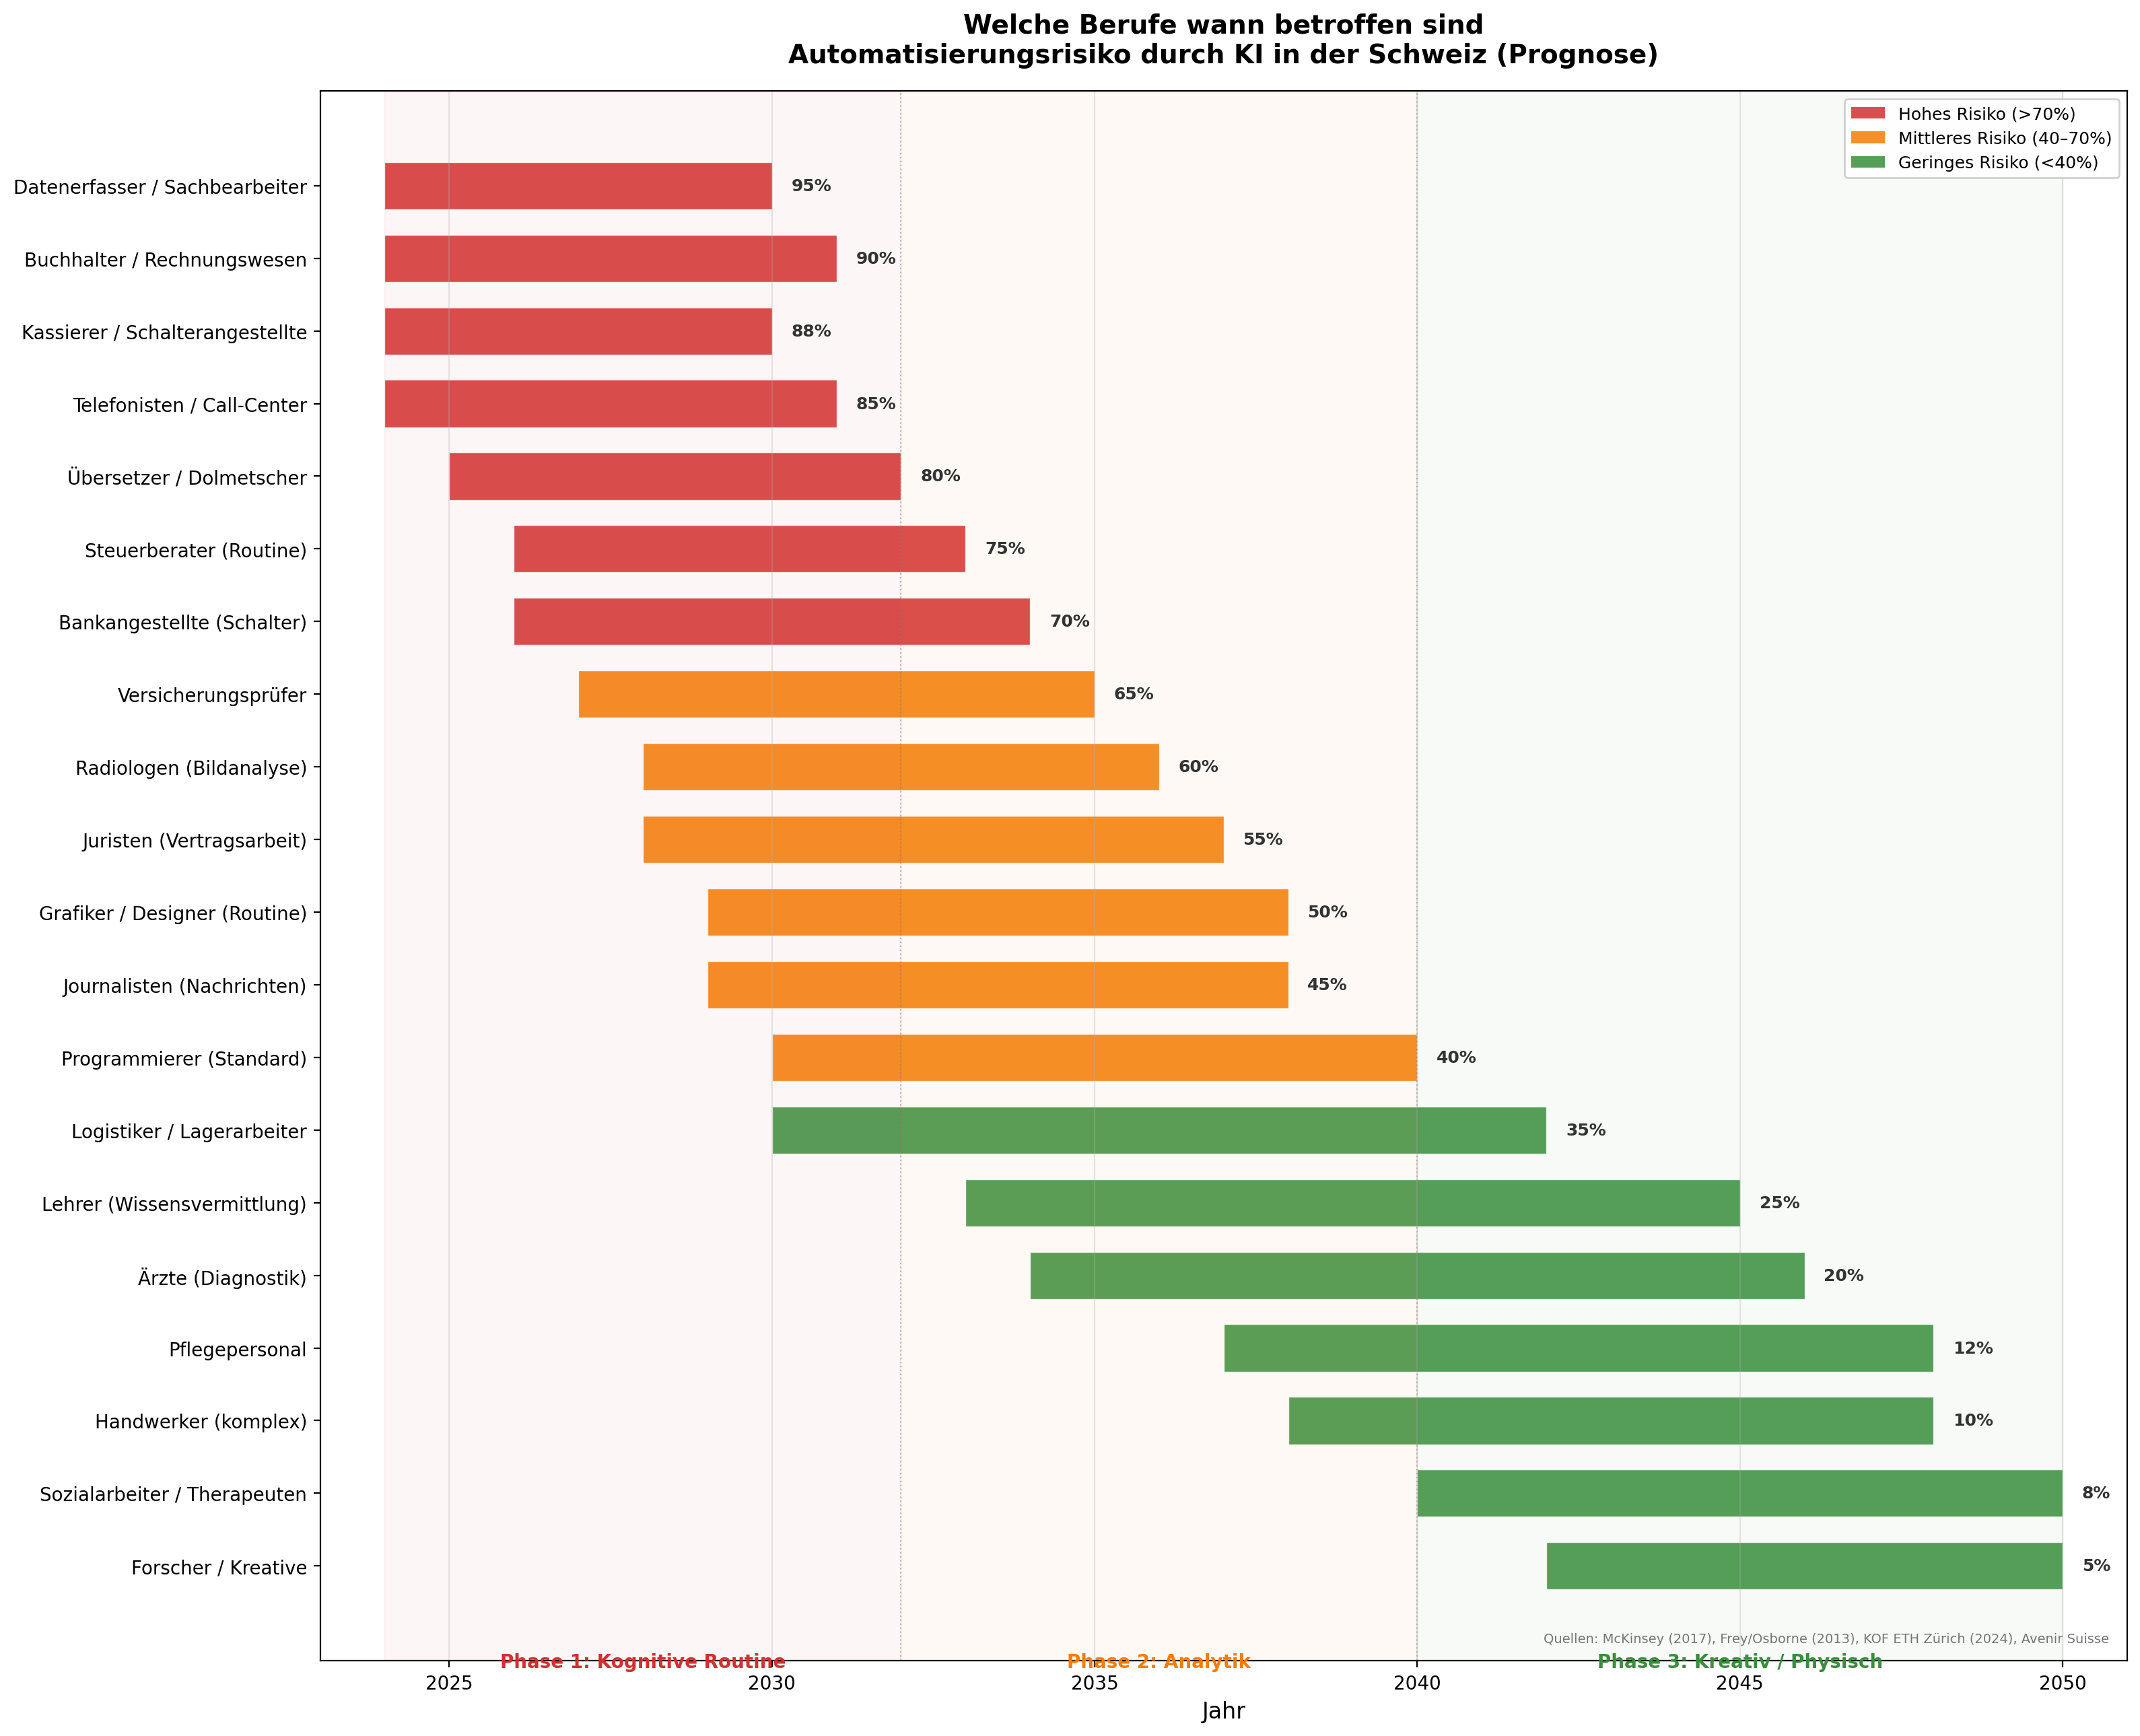
Description: Timeline 2025--2050 with 20 occupational groups, ordered by automation risk. The horizontal bars show when the transformation begins for each profession and when it is largely complete. Red: High risk >70% (Data entry 95%, Accountants 90%, Cashiers 88% -- affected from 2024). Orange: Medium risk 40--70% (Insurance examiners 65%, Radiologists 60%, Lawyers 55% -- affected from ~2028). Green: Low risk <40% (Teachers 25%, Doctors 20%, Nurses 12%, Researchers 5% -- affected only from ~2035-2042). Three phases: Cognitive Routine (until 2032), Analytics (2032--2040), Creative/Physical (from 2040).
Sources: McKinsey Global Institute (2017/2023); Frey/Osborne, Oxford Martin School (2013/2017); KOF ETH Zürich (2024); Avenir Suisse
Usage: Status Quo -- Overview, AI in the Swiss Economy, Forecast: Work, Risk: Labour Market
¶ Chapter 2: Forecasts
¶ Fertility Rates Worldwide
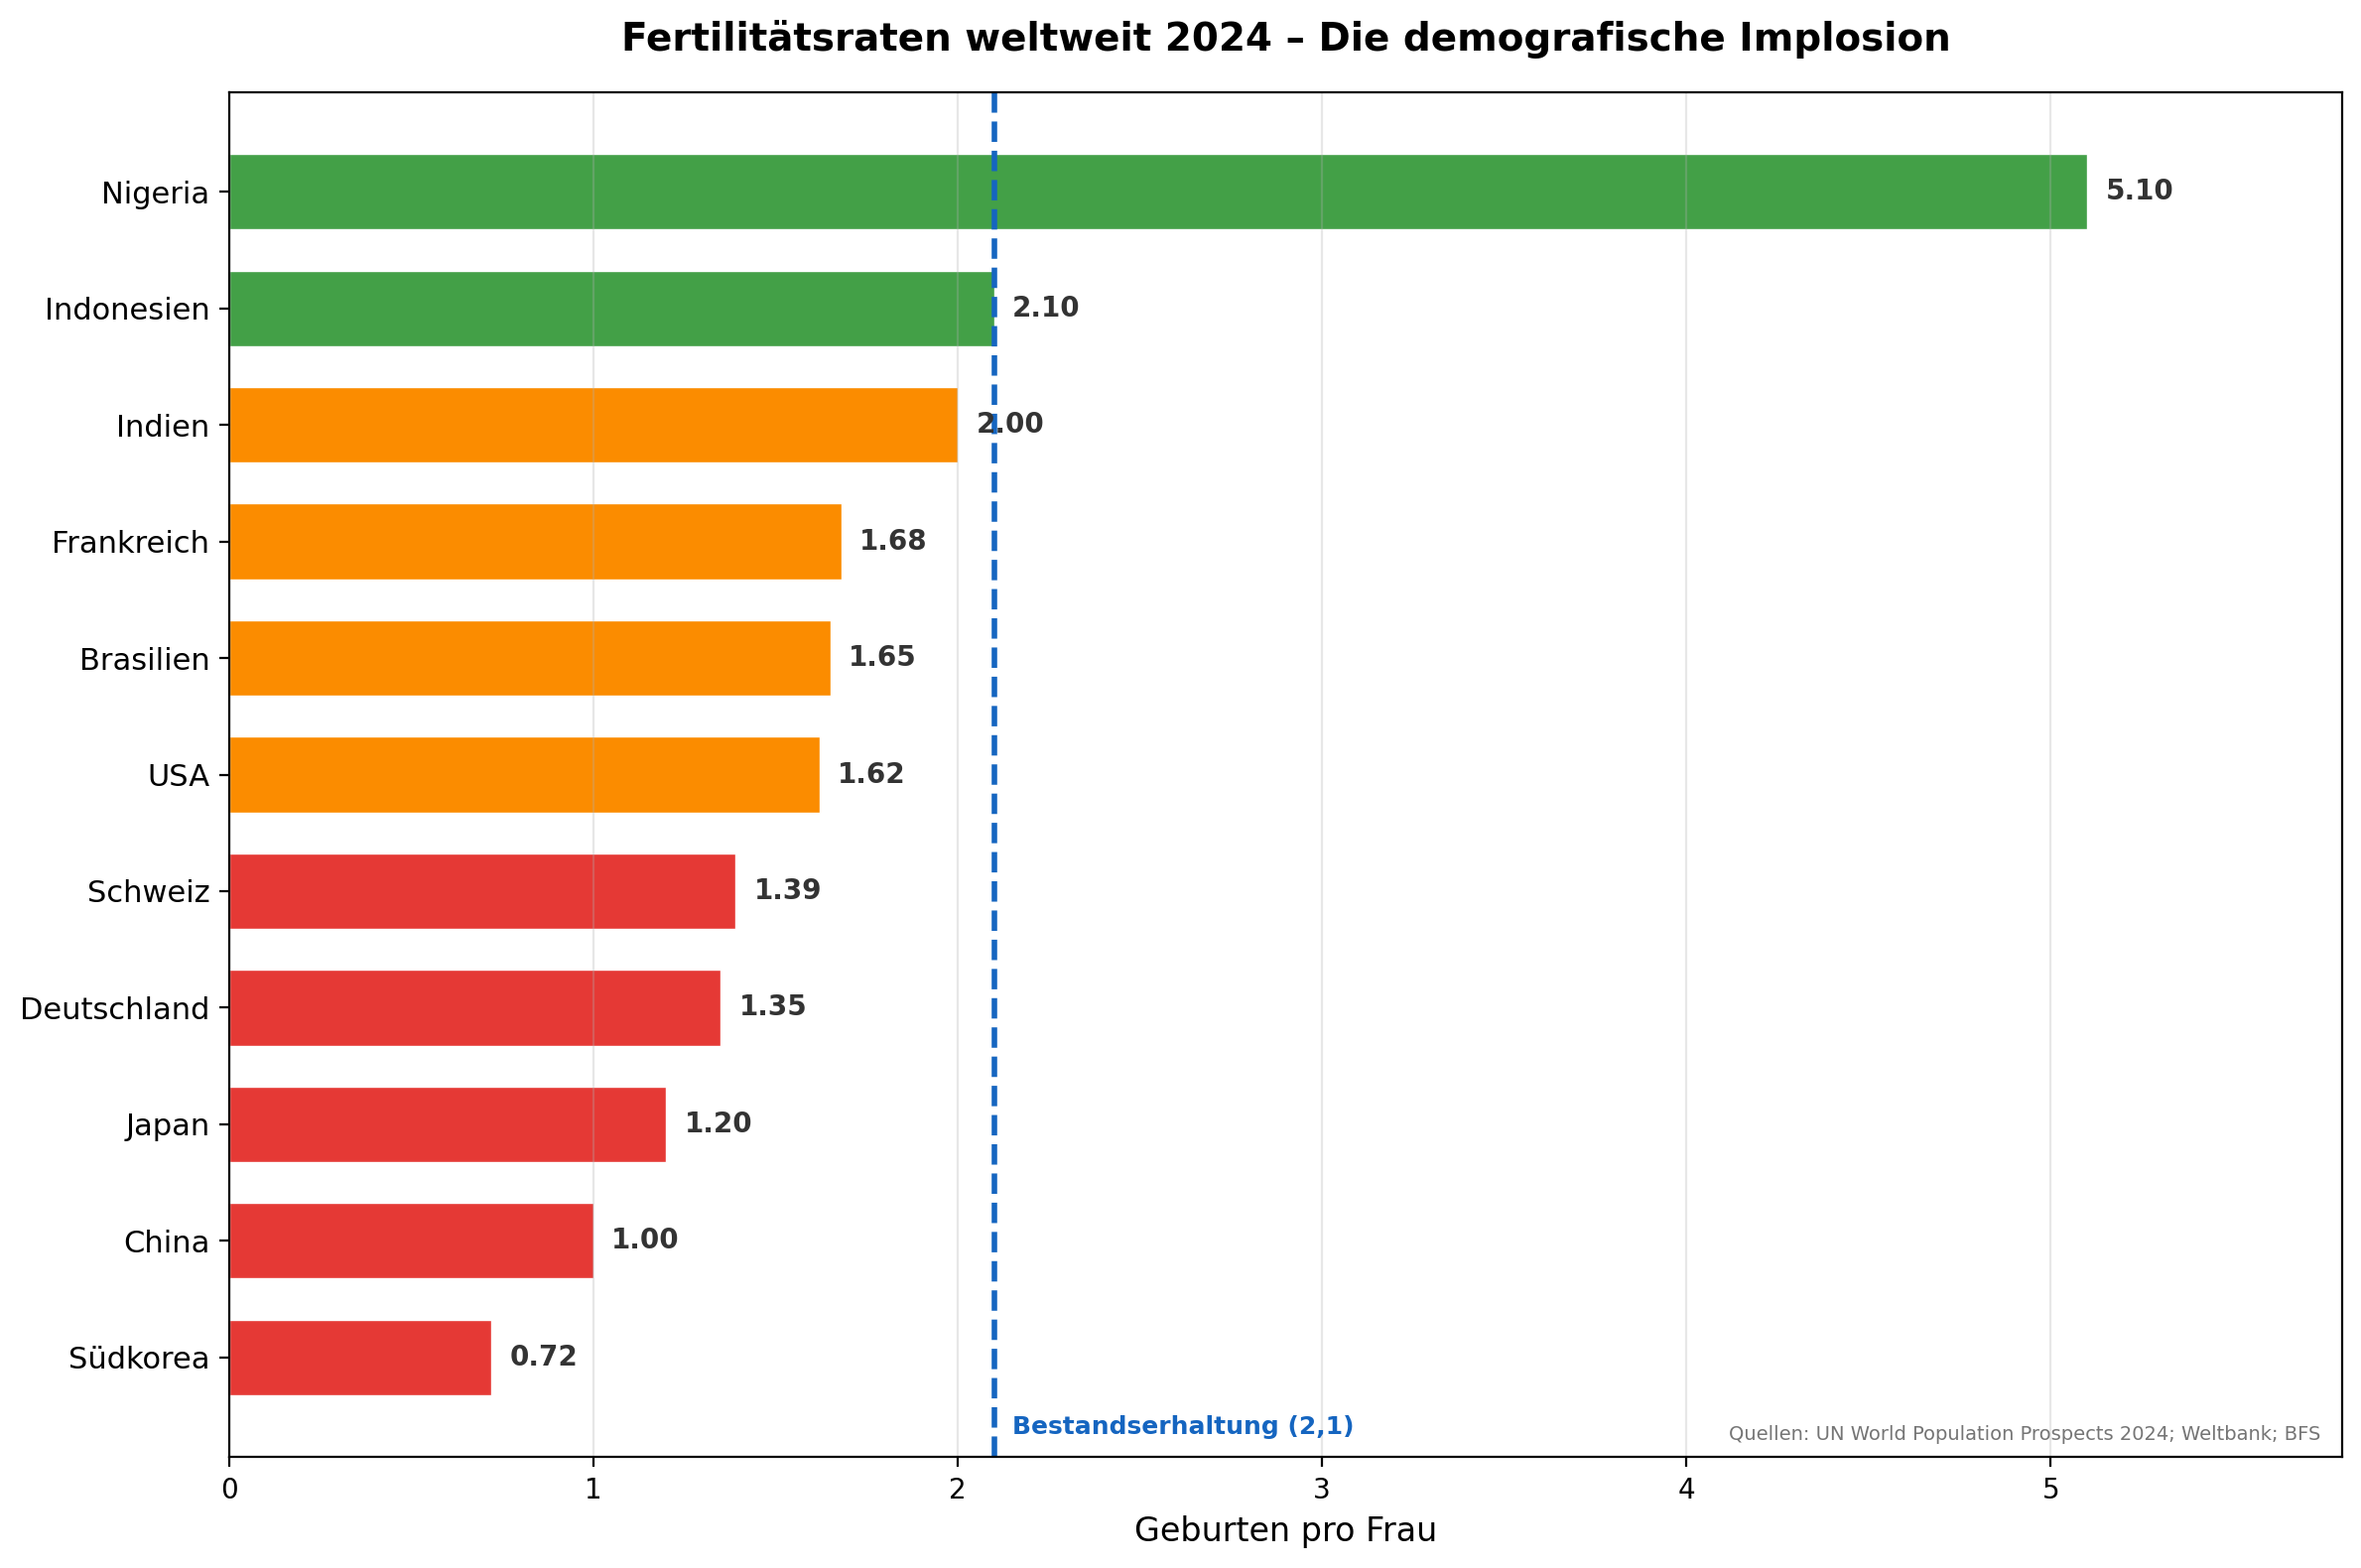
Description: Compares fertility rates of selected countries (as of 2024): South Korea 0.72 -- Japan 1.20 -- Germany 1.35 -- Switzerland 1.39 -- USA 1.62 -- France 1.68 -- India 2.03. The red line at 2.1 marks the replacement rate needed for a stable population. Almost no industrialised country reaches it any more.
Sources: World Bank, World Development Indicators 2024; BFS (Swiss fertility rate)
Usage: Forecast: Demographics, Risk: Demographics
¶ Population Development of Switzerland
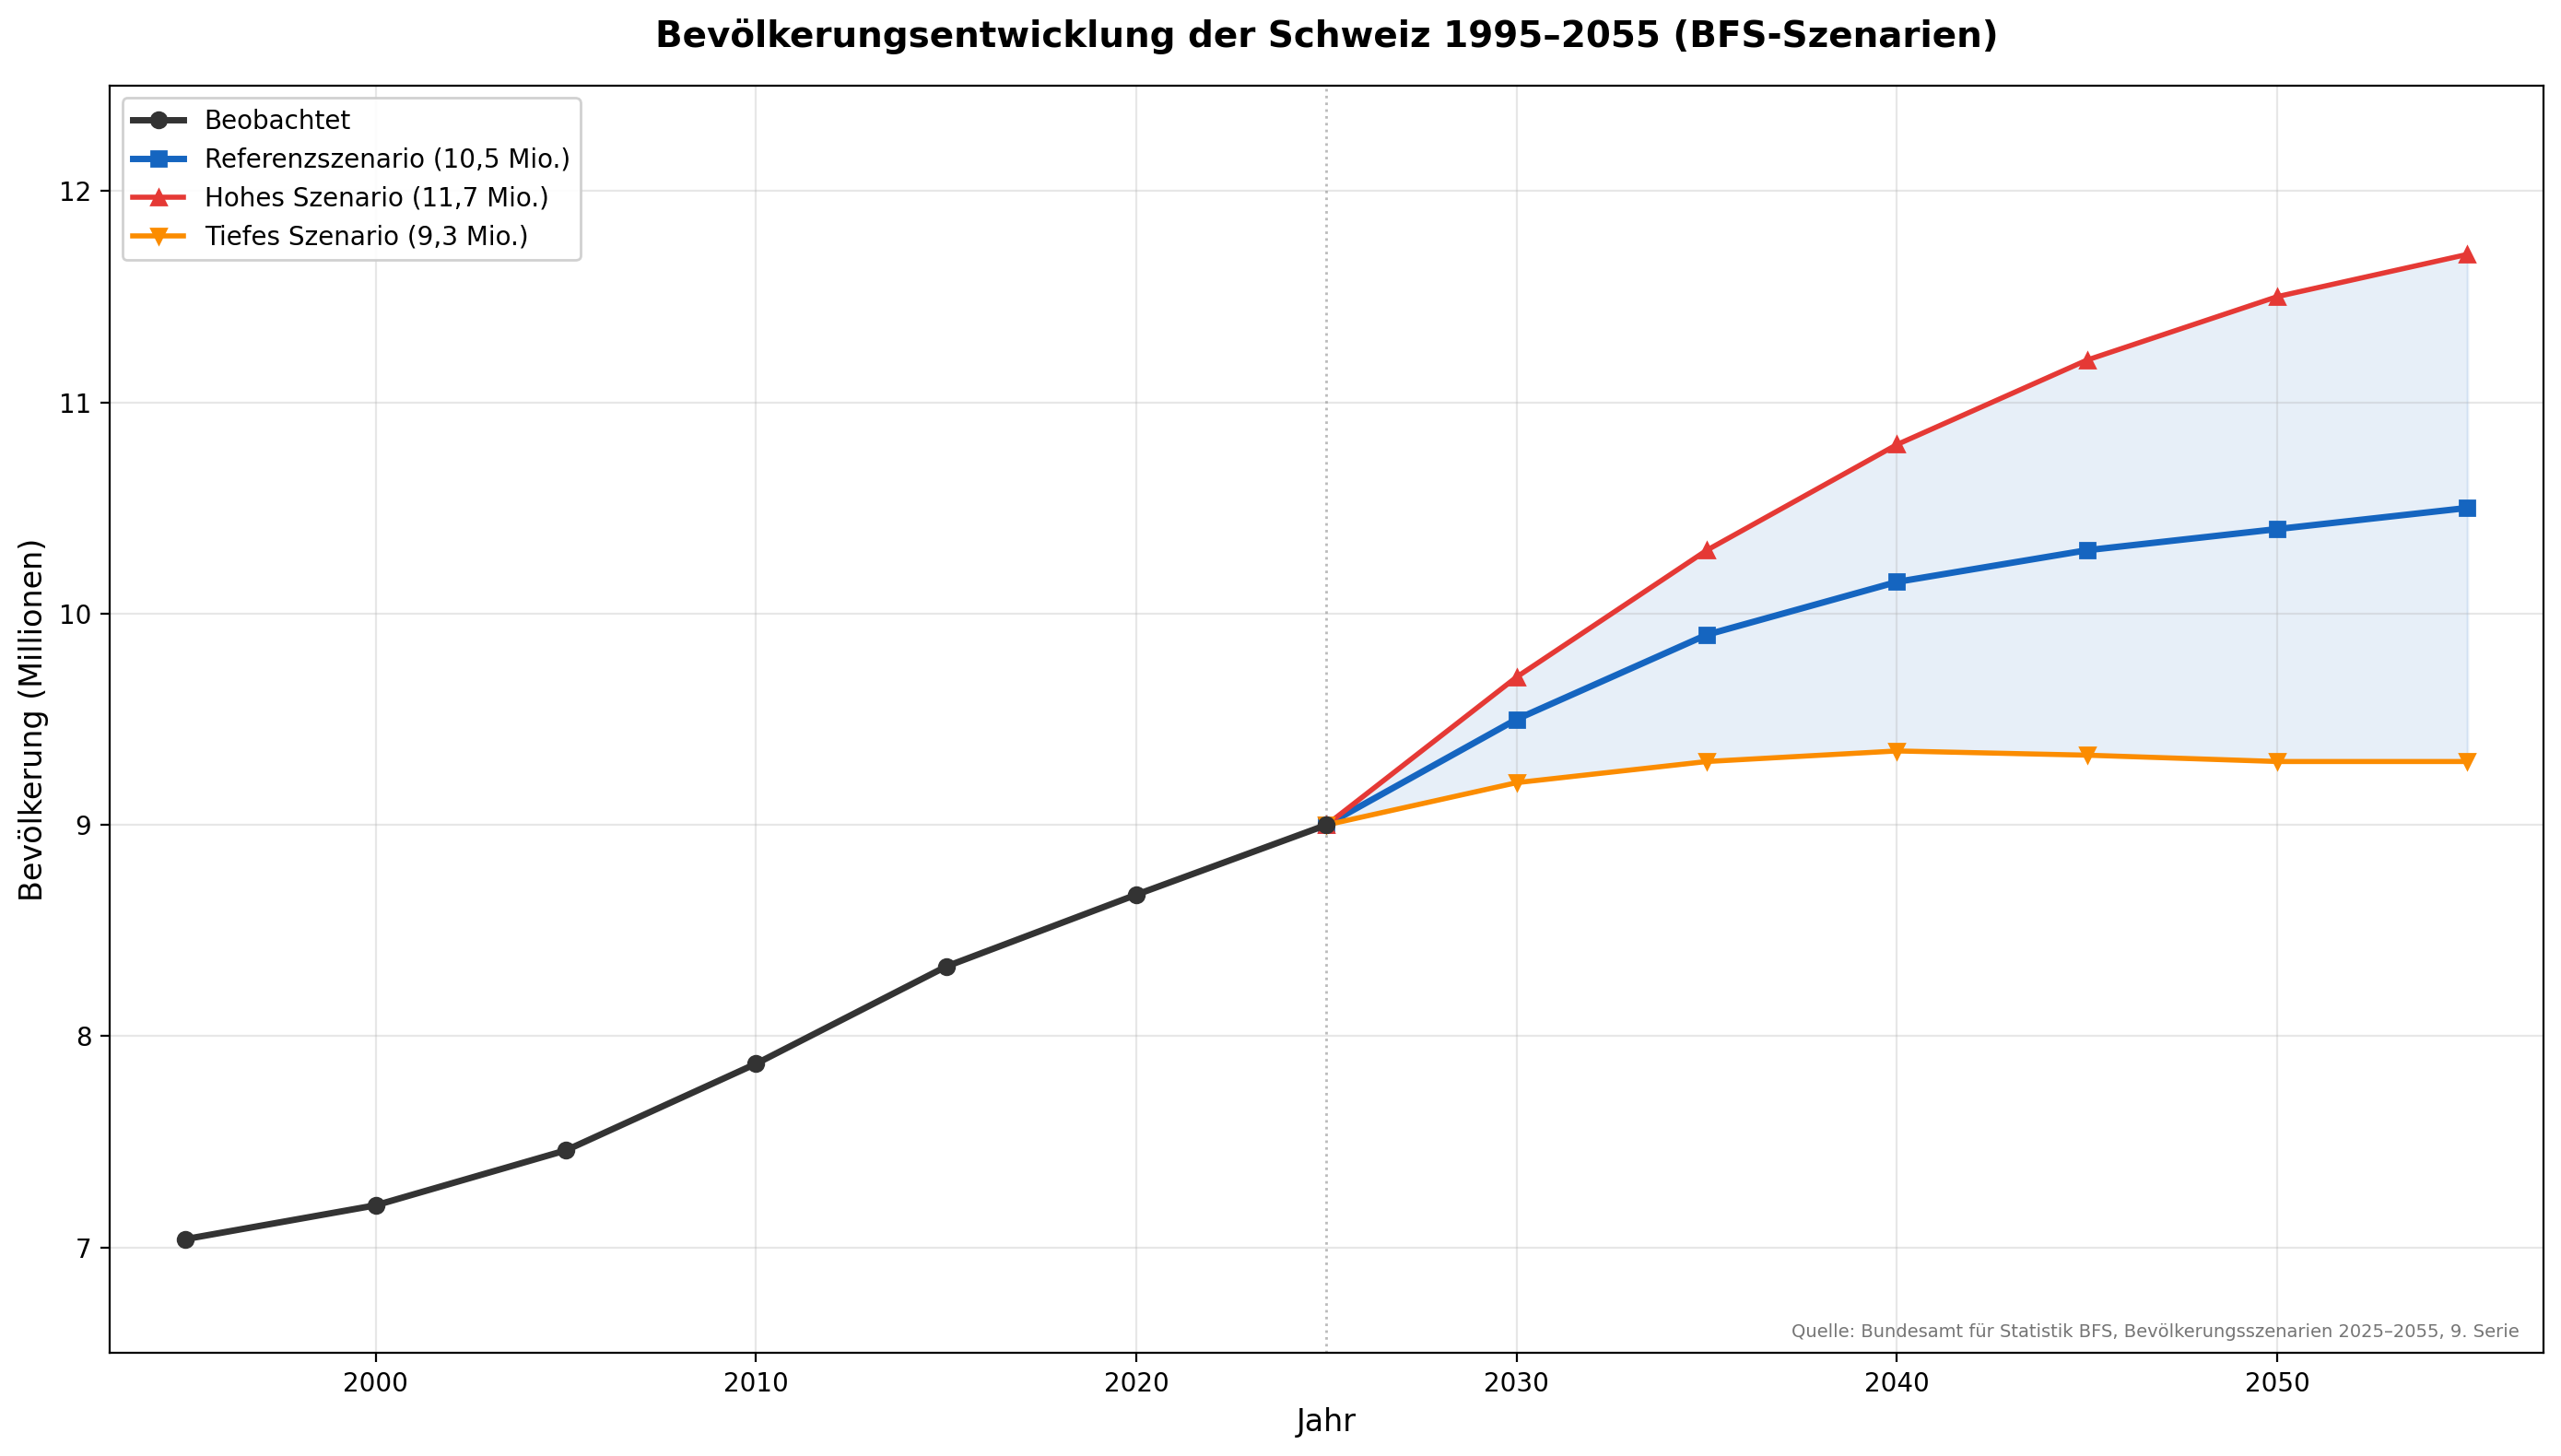
Description: Shows the three BFS scenarios (high, medium, low) for the Swiss population until 2055. The medium scenario projects around 10.4 million inhabitants. Visualises the ageing of society and the declining share of working-age population (20--64 years) in the total population.
Sources: Federal Statistical Office (BFS), Population Scenarios 2020--2050, Reference Scenario A-00-2020
Usage: Forecast: Demographics, Risk: Demographics
¶ Gold and the Franc
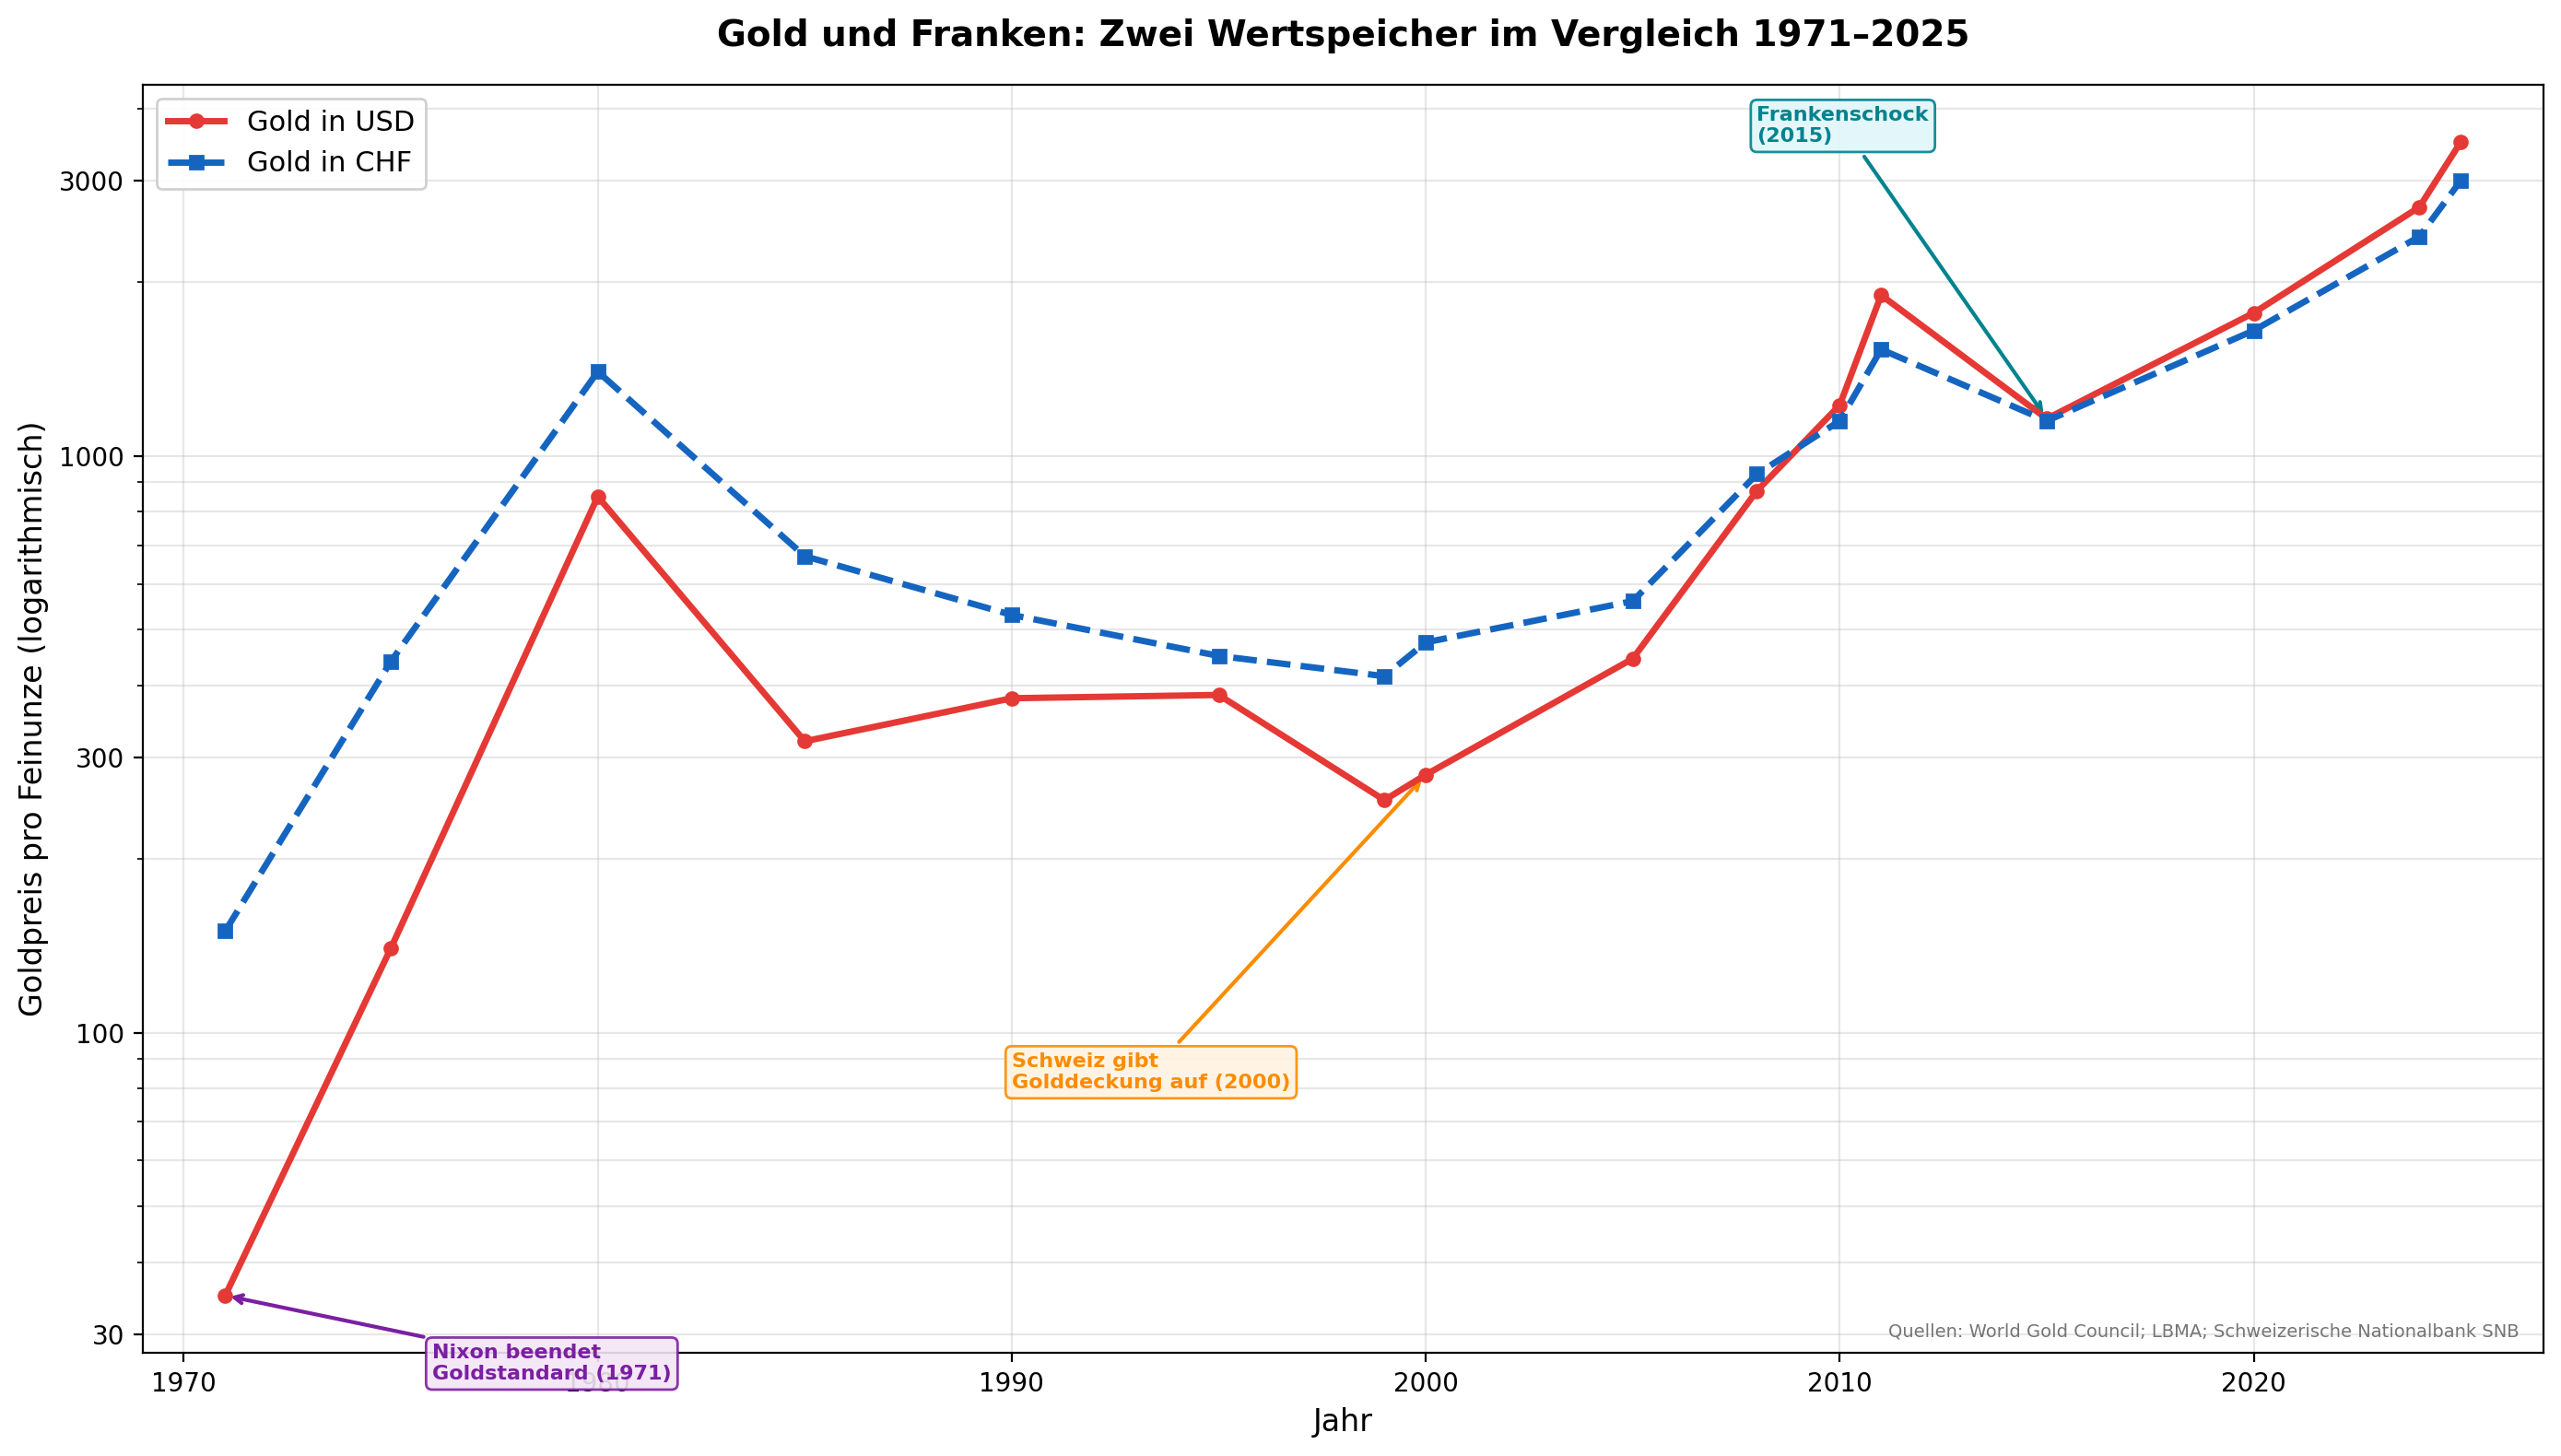
Description: Compares the value development of gold (in USD/ounce) and the Swiss franc (EUR/CHF exchange rate) since the end of Bretton Woods (1971). Both serve as stability anchors in an era when fiat currencies are structurally losing purchasing power. Gold rose from 35 USD (1971) to over 2,000 USD (2024); the franc continuously appreciated against the euro.
Sources: SNB (exchange rates); World Gold Council (gold price); Thomas Mayer, Flossbach von Storch
Usage: Forecast: Money
¶ Energy Consumption of Global Data Centres
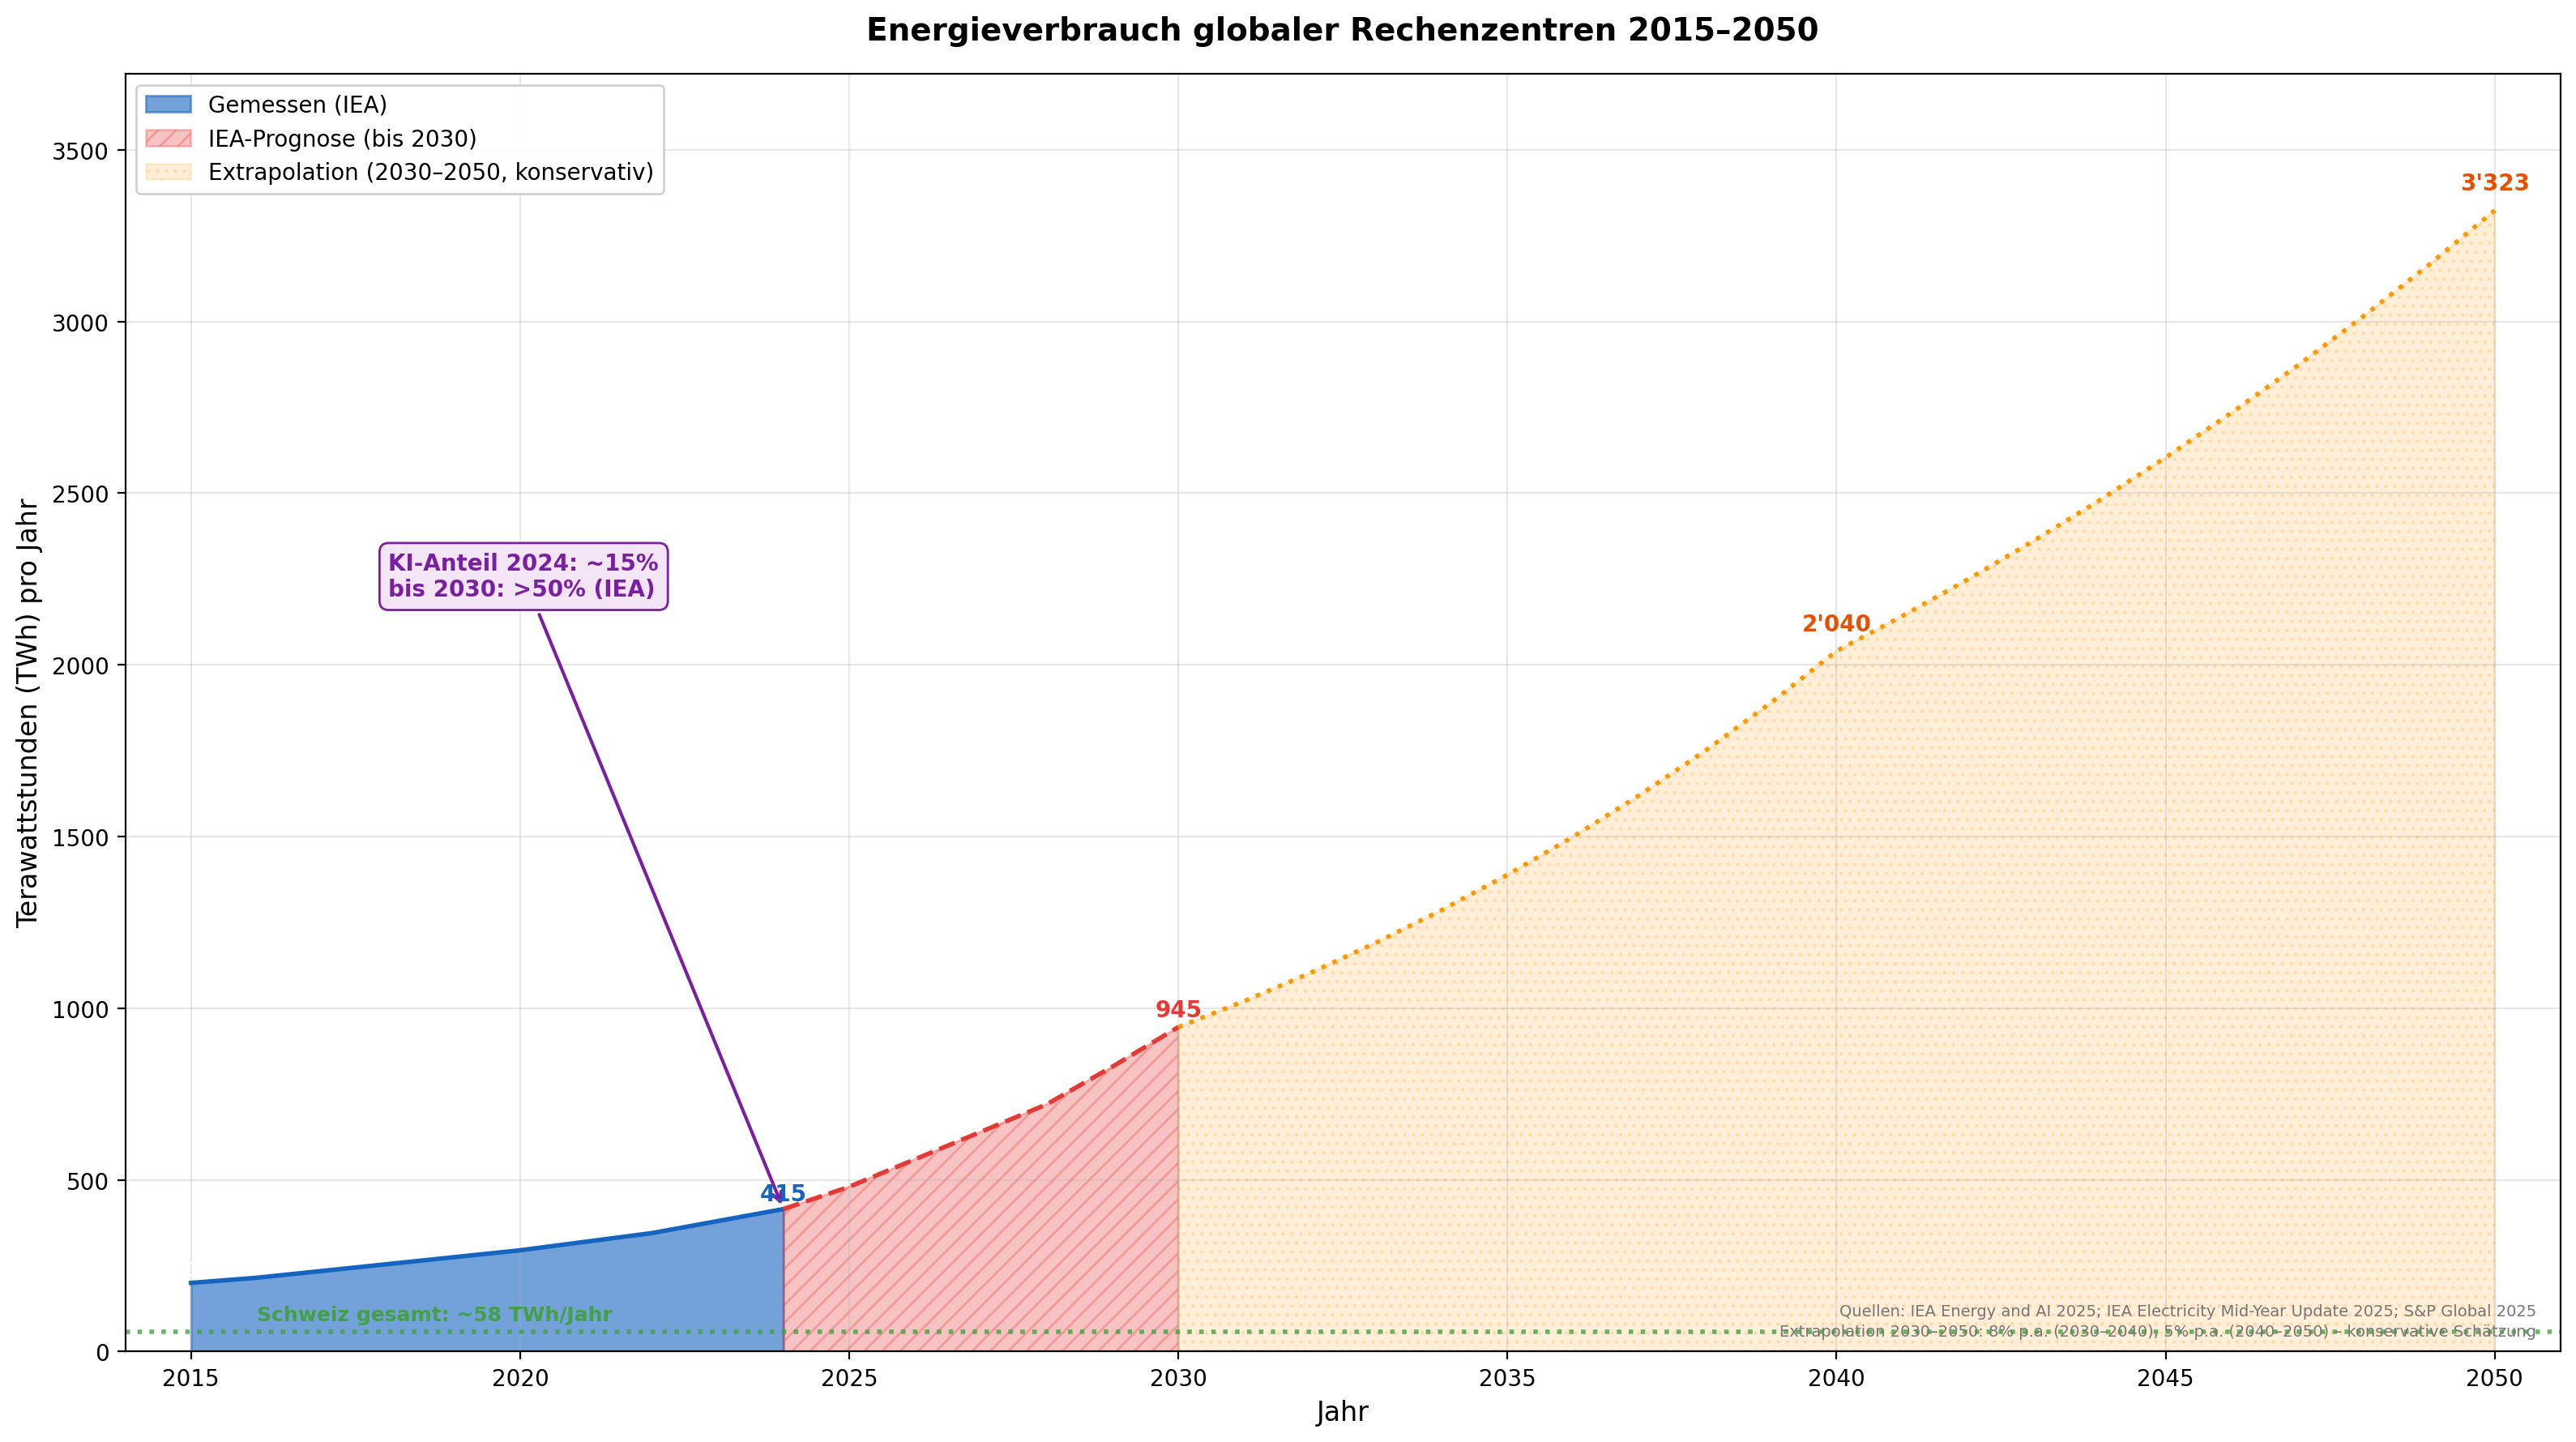
Description: Global electricity consumption of data centres from 2015 to 2050 in three phases: Measured (blue, 200 TWh 2015 to 415 TWh 2024), IEA Forecast (red hatched, 945 TWh to 2030), Extrapolation (orange, up to ~3,300 TWh 2050). The AI share of total consumption was around 15% in 2024 and is expected to rise to over 50% by 2030 according to the IEA. For scale: all of Switzerland consumes ~58 TWh/year.
Sources: IEA Energy and AI 2025; IEA Electricity Mid-Year Update 2025; S&P Global 2025. Extrapolation 2030--2050: 8% p.a. (2030--2040), 5% p.a. (2040--2050) -- conservative estimate.
Usage: Forecast: Space
¶ Chapter 4: Risks
¶ Population, Working-Age Population and AI Displacement
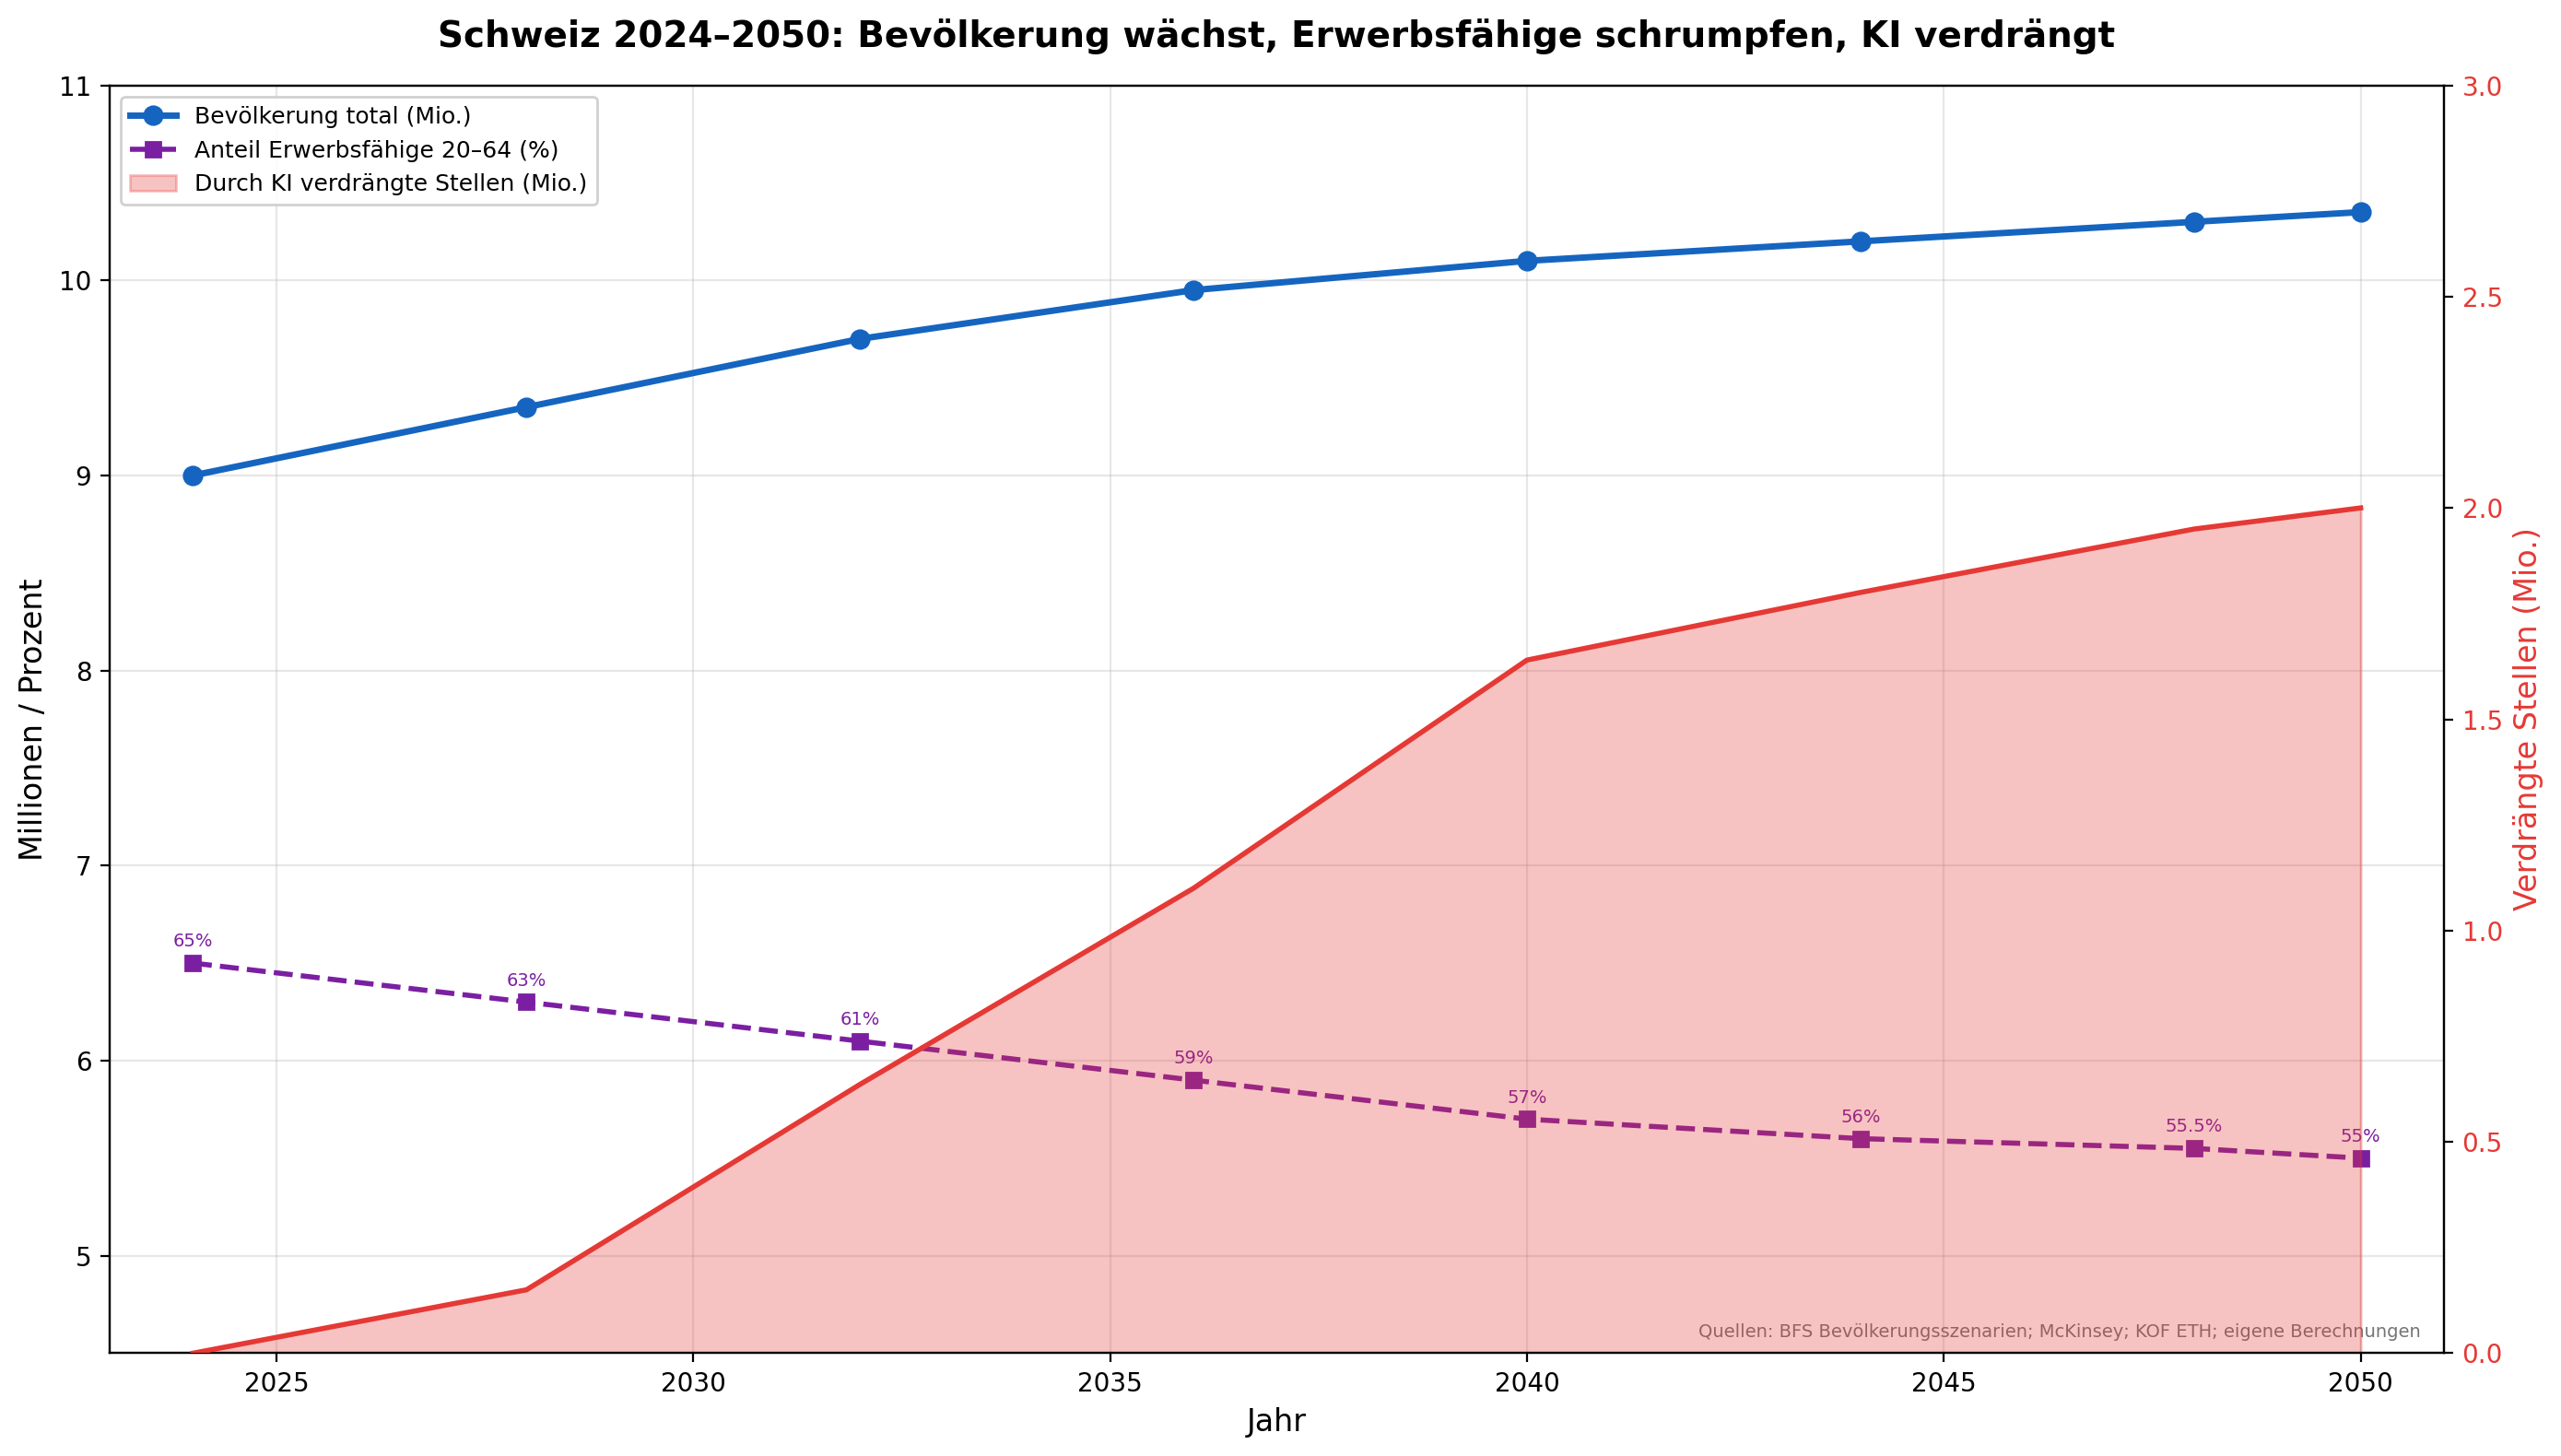
Description: Three-line chart of Switzerland 2024--2050: Total population (rising to ~10.4 million), Working-age 20--64 (stagnating/slightly declining), Effectively employed after AI displacement (significantly declining to ~3.5 million). Shows the "double scissors": fewer working-age people due to demographics, plus fewer employed due to AI automation.
Sources: BFS Population Scenarios; McKinsey Global Institute; own model calculation
Usage: Risk: Labour Market
¶ Fiscal Gap

Description: Calculates the annual fiscal gap with gradual elimination of wage-dependent state financing (AHV, IV, EO, ALV, direct federal tax, cantonal/municipal taxes). Conservative scenario: 75 billion CHF/year real. Medium scenario: 116 billion CHF/year nominal (incl. inflation of 1.5% p.a. until 2050). This gap corresponds to approximately half of today's federal budget.
Sources: BFS; EFV (Federal Finances); BSV (AHV expenditure ~50 billion CHF/year); own model calculation
Usage: Risk: Labour Market
¶ Family Budget 2024--2050
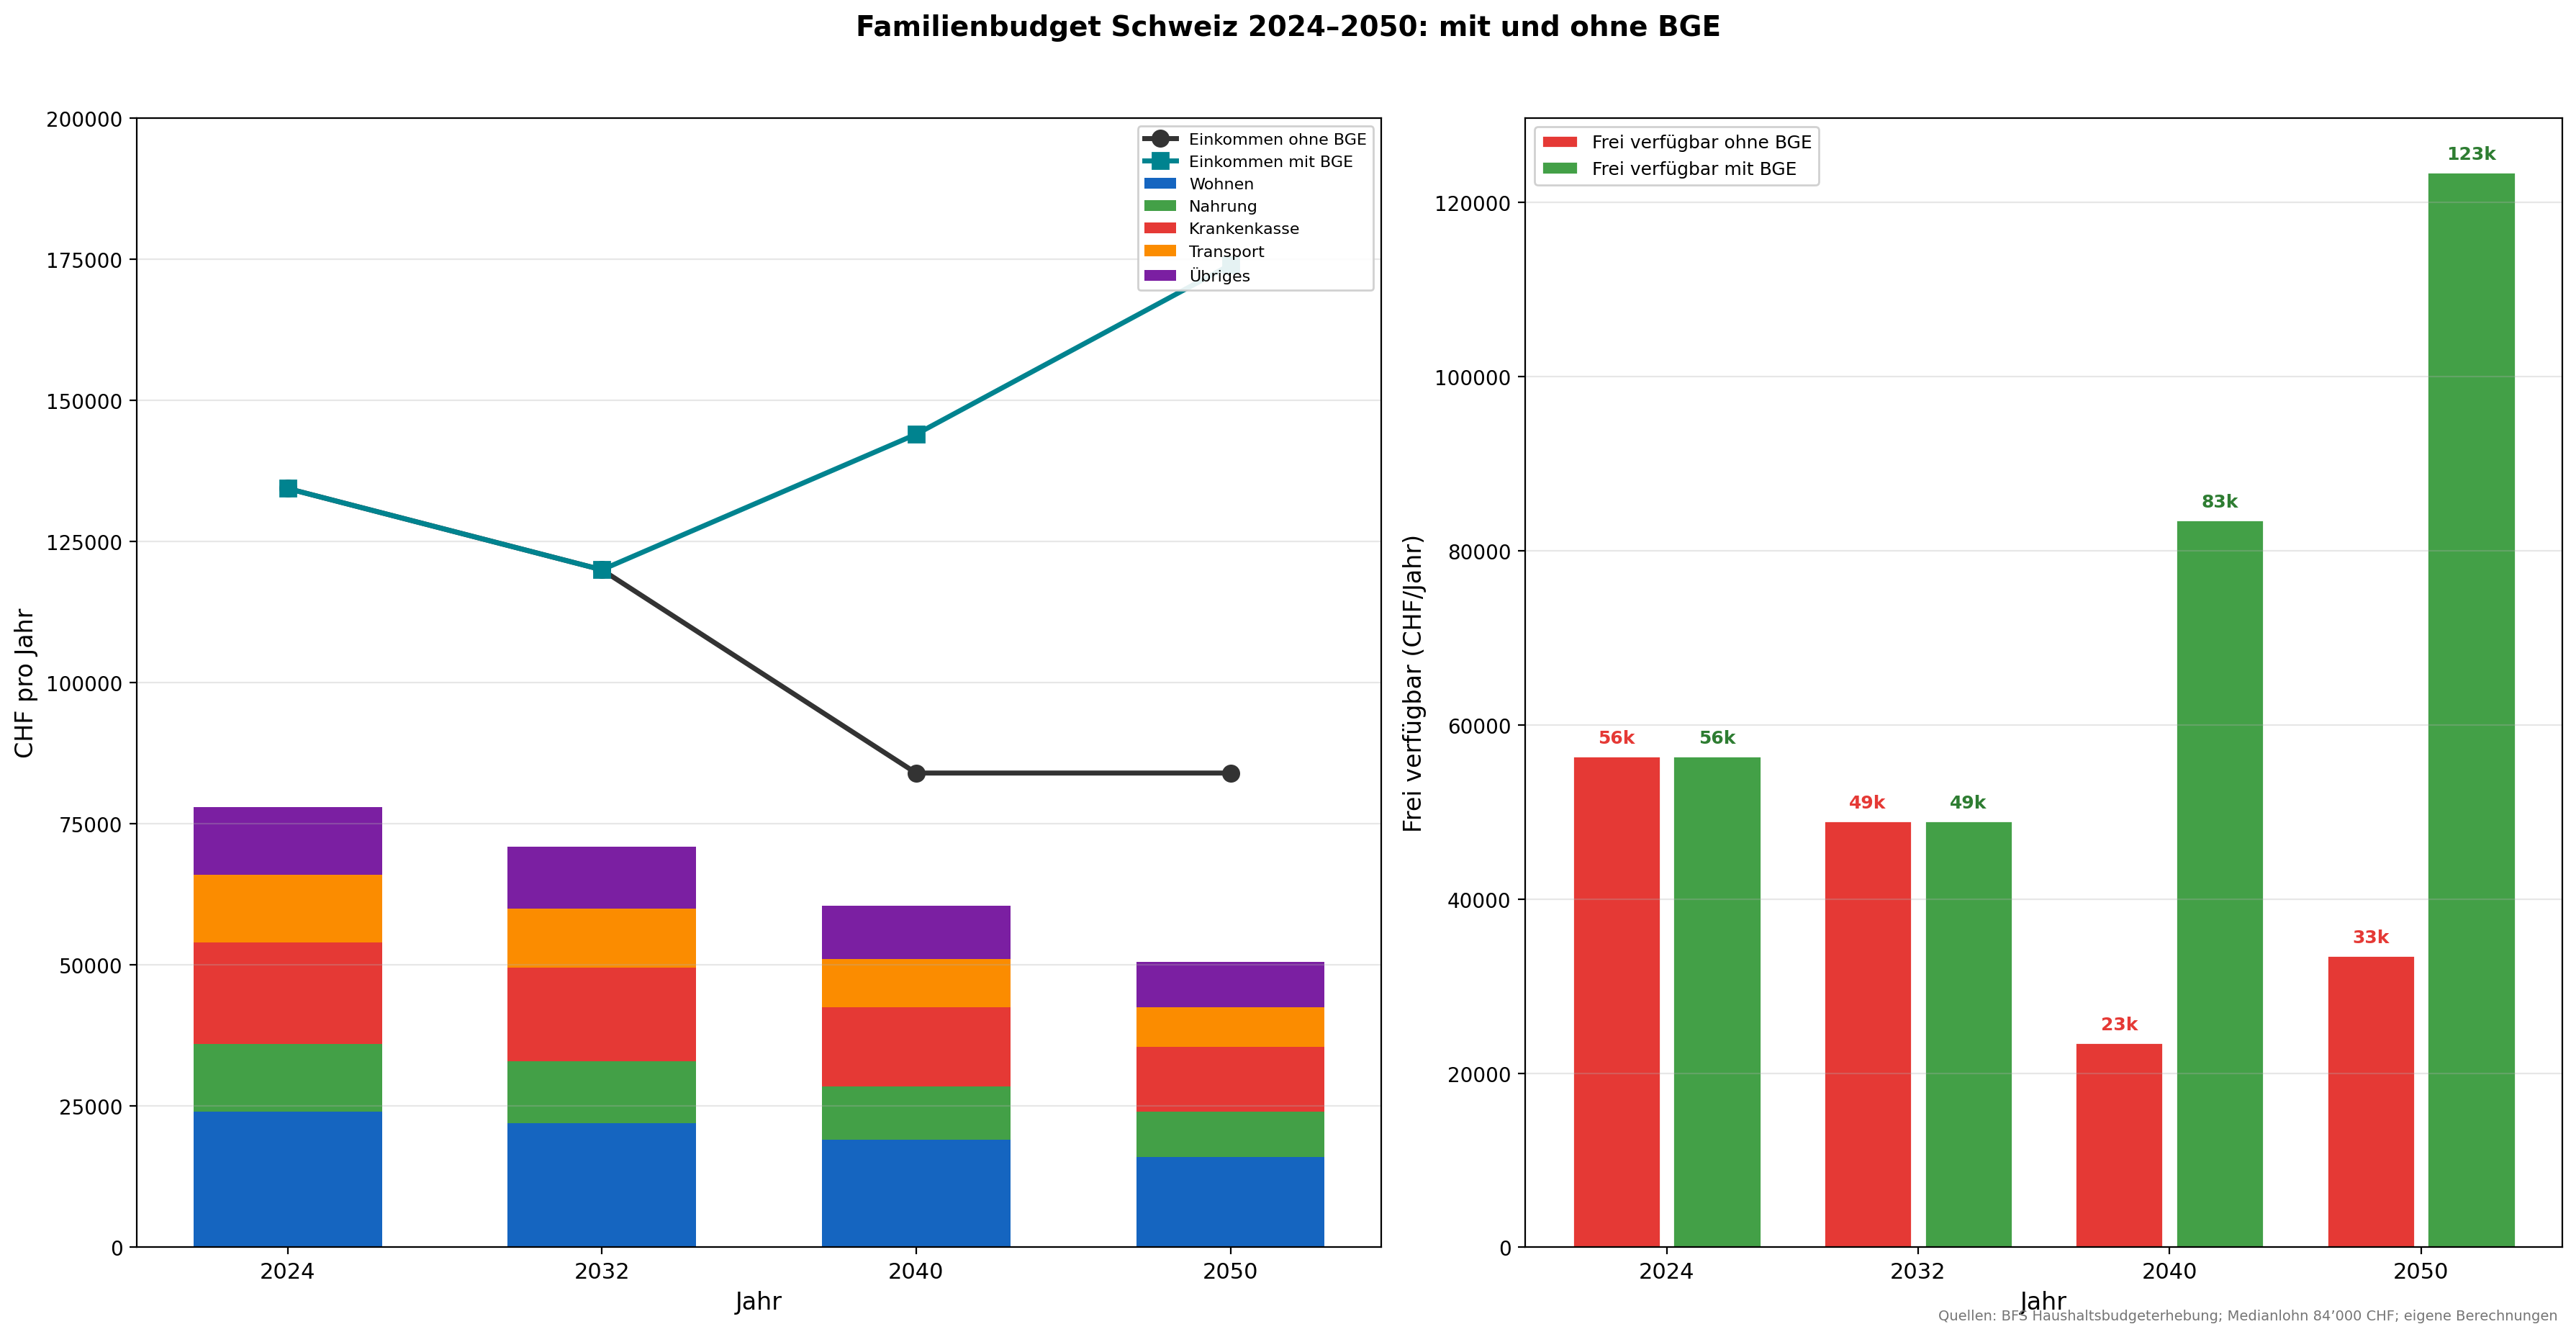
Description: Model calculation for an average Swiss family (Thomas, 47, clerk; Sandra, 44, accountant; median salary 84,000 CHF). Shows the gradual income loss through AI automation alongside AI-driven deflation of living costs (food, clothing, electronics drop by ~35%). Result: without a citizens' dividend, impoverishment threatens -- incomes fall faster than prices.
Sources: BFS (median salary, household budget survey); own model calculation
Usage: Risk: Family Budget
¶ Chapter 5: Demands
¶ Replacement of OASI by the Citizens' Dividend
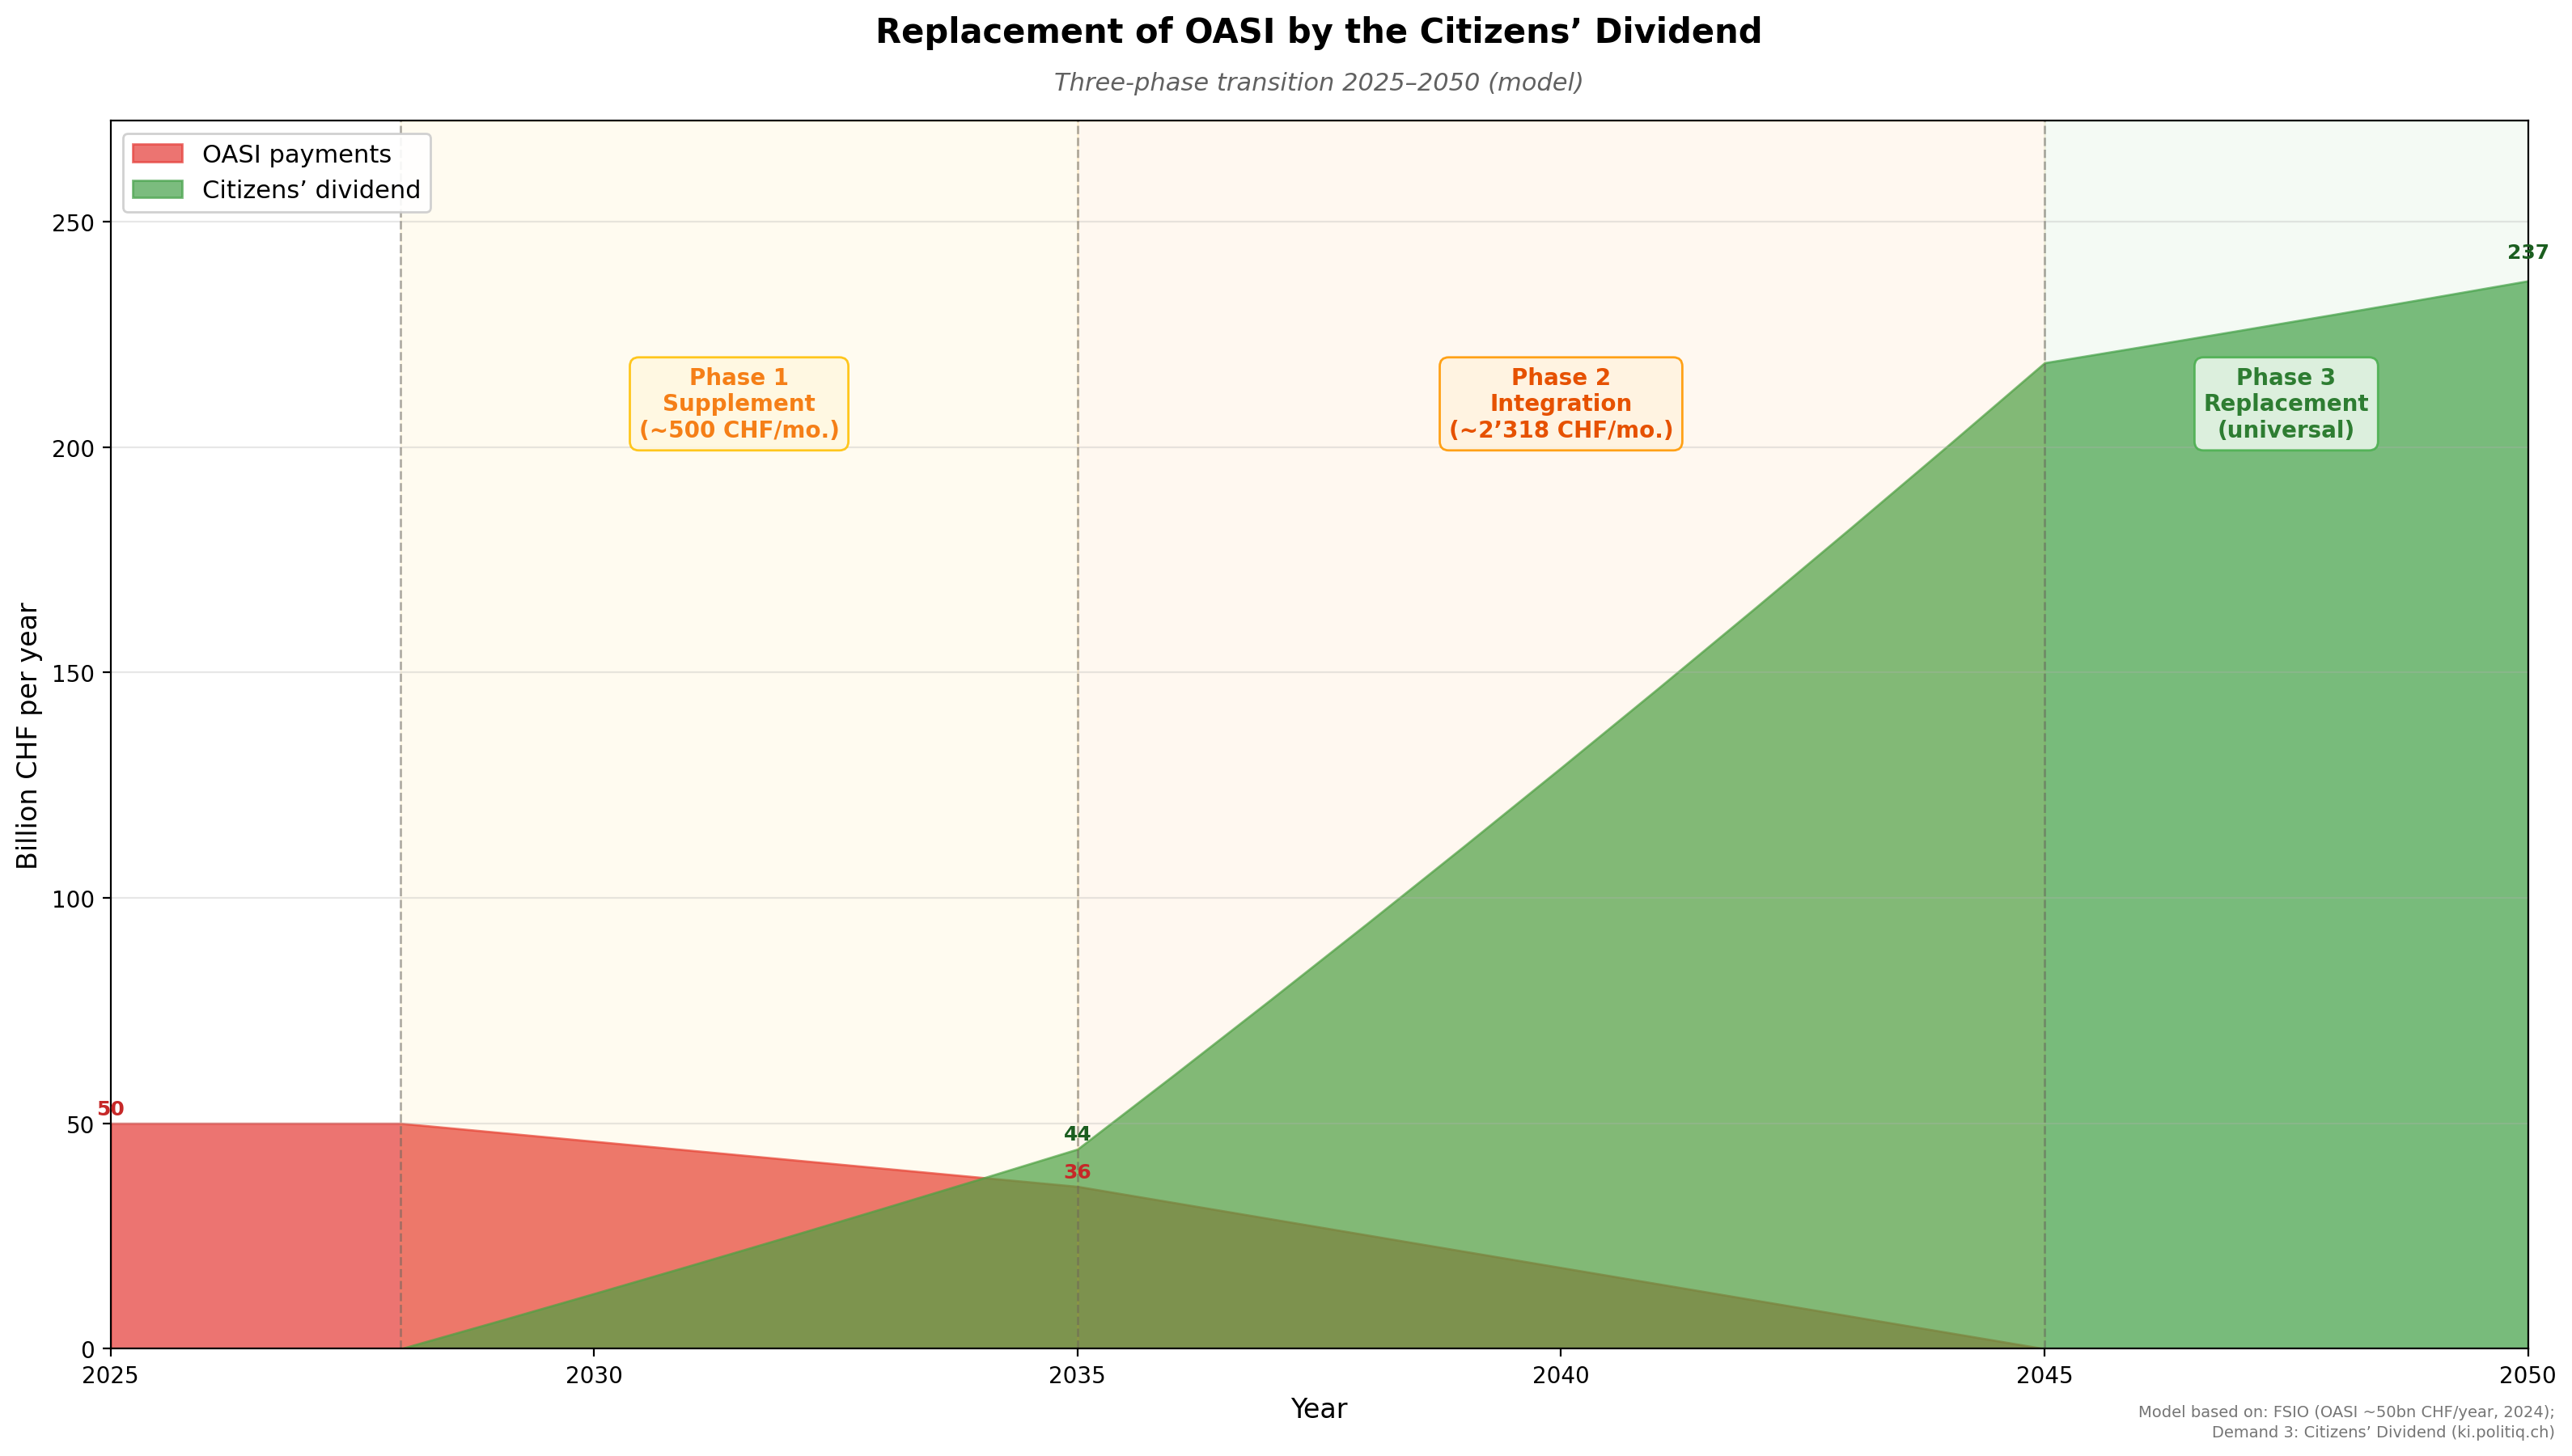
Description: Three-phase model of the transition from OASI to the citizens' dividend: Phase 1 (2028--2035): Citizens' dividend as supplement (~500 CHF/month), OASI continues. Phase 2 (2035--2045): Citizens' dividend rises to ~2,318 CHF/month, OASI is gradually integrated. Phase 3 (from 2045): Universal citizens' dividend replaces OASI, DI and social assistance. Red = OASI payments (declining), Green = Citizens' dividend (rising). Population growth factored in: ~6.9 million adults (2025) → ~8.1 million (2050), per BFS reference scenario.
Sources: BSV (OASI expenditure ~50 billion CHF/year, 2024); BFS Population Scenarios; model calculation based on Demand 3
Usage: Demand 3: Citizens' Dividend
¶ Average Income Development with Citizens' Dividend
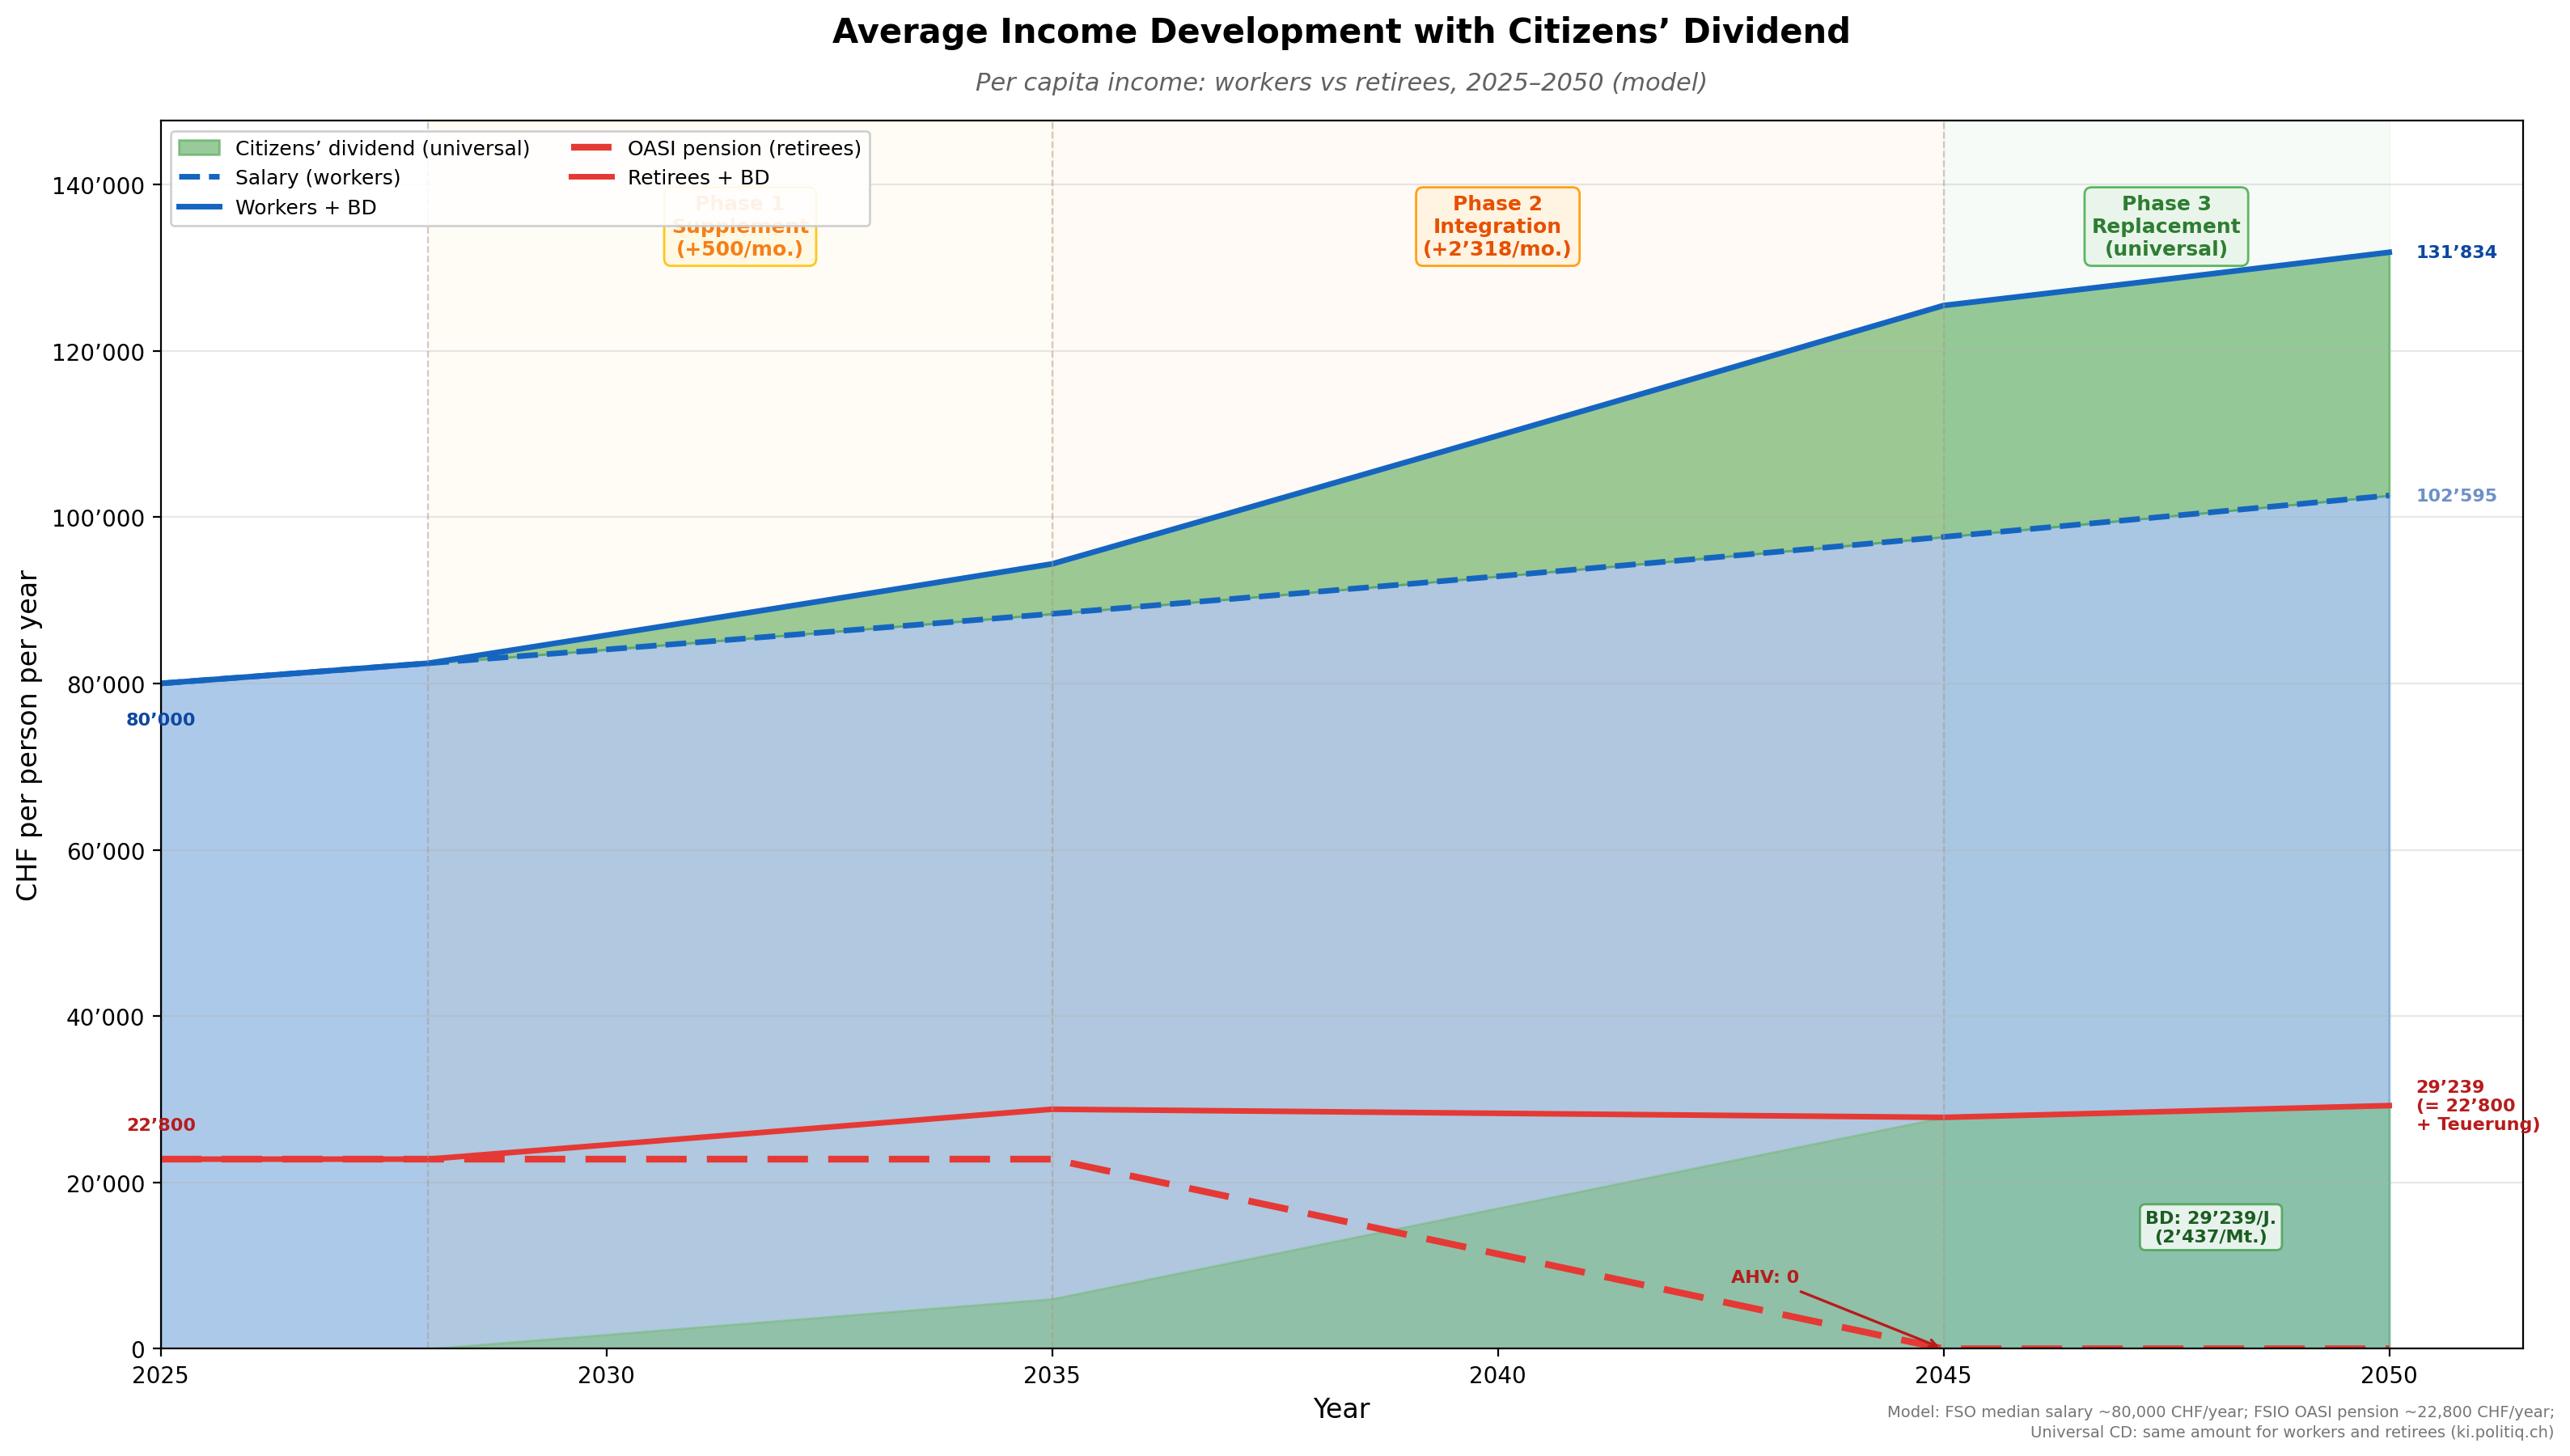
Description: Per capita income development for workers and retirees. Workers (blue): Median salary ~80,000 CHF/year remains stable, the universal citizens' dividend (green area) is added on top (~29,200 CHF/year by 2050). Retirees (red): OASI pension gradually declines to zero (dashed line), but is exactly replaced by the same universal citizens' dividend. No net increase for retirees: by 2050 they receive ~29,200 CHF/year (= 22,800 + inflation). Same CD amount for everyone.
Sources: BFS median salary ~80,000 CHF/year (2025); BSV OASI pension ~22,800 CHF/year; BFS Population Scenarios
Usage: Demand 3: Citizens' Dividend
¶ Source Note
All charts were created for this wiki. The underlying data comes from publicly accessible sources (BFS, IMF, IEA, McKinsey, KOF ETH, SNB). The complete source overview can be found under Sources and Methodology.
The Python scripts for reproducing all charts are available in the project repository under scripts/.
Charts: , 2026. Licence: CC BY-SA 4.0